Cree vs Immigrants from Eastern Africa In Labor Force | Age 45-54
COMPARE
Cree
Immigrants from Eastern Africa
In Labor Force | Age 45-54
In Labor Force | Age 45-54 Comparison
Cree
Immigrants from Eastern Africa
80.8%
IN LABOR FORCE | AGE 45-54
0.0/ 100
METRIC RATING
288th/ 347
METRIC RANK
83.9%
IN LABOR FORCE | AGE 45-54
99.8/ 100
METRIC RATING
20th/ 347
METRIC RANK
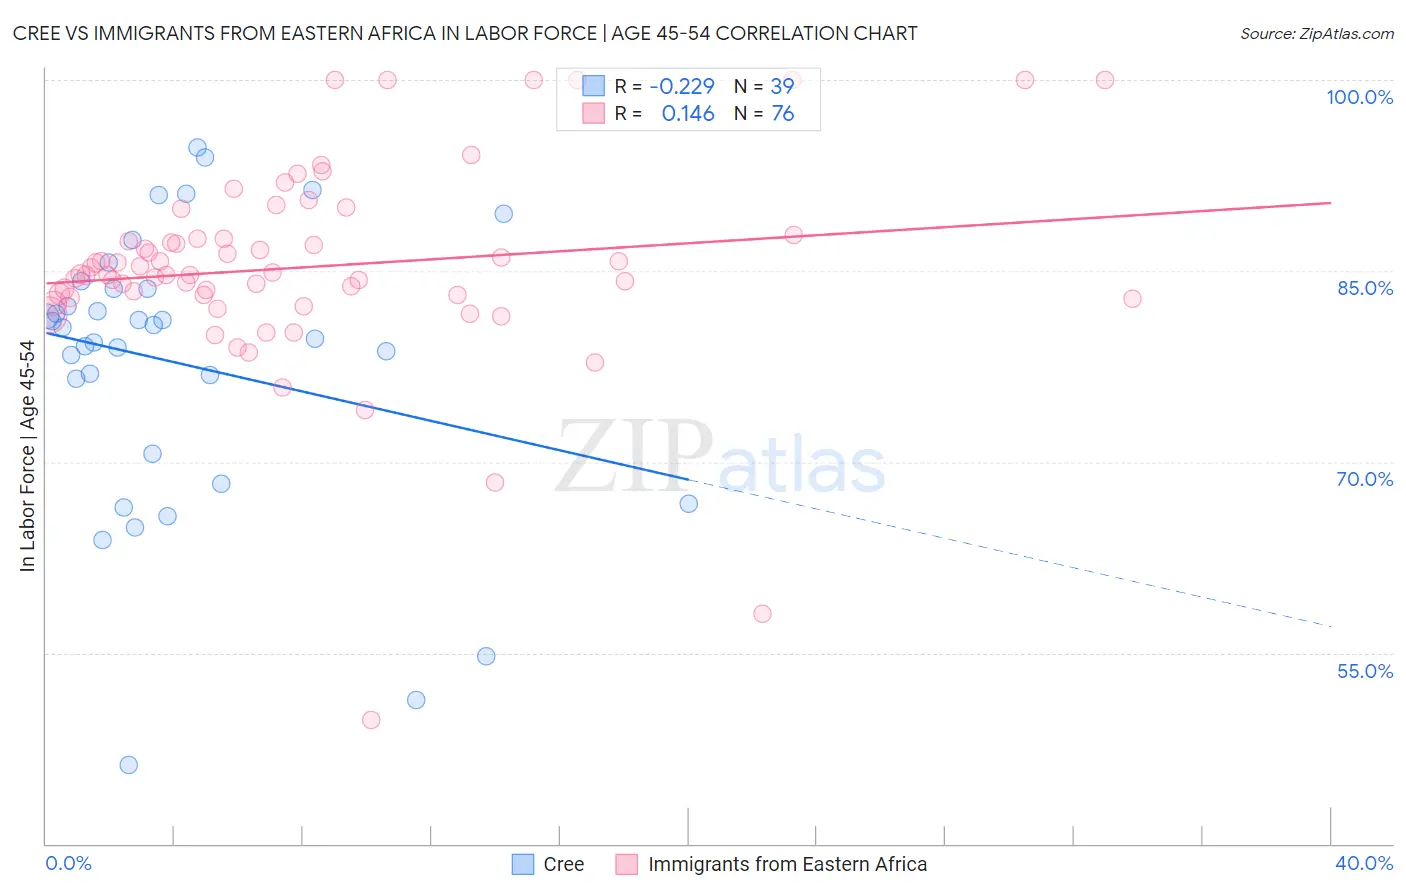
Cree vs Immigrants from Eastern Africa In Labor Force | Age 45-54 Correlation Chart
The statistical analysis conducted on geographies consisting of 76,209,843 people shows a weak negative correlation between the proportion of Cree and labor force participation rate among population between the ages 45 and 54 in the United States with a correlation coefficient (R) of -0.229 and weighted average of 80.8%. Similarly, the statistical analysis conducted on geographies consisting of 354,881,316 people shows a poor positive correlation between the proportion of Immigrants from Eastern Africa and labor force participation rate among population between the ages 45 and 54 in the United States with a correlation coefficient (R) of 0.146 and weighted average of 83.9%, a difference of 3.9%.
In Labor Force | Age 45-54 Correlation Summary
| Measurement | Cree | Immigrants from Eastern Africa |
| Minimum | 46.2% | 49.7% |
| Maximum | 94.7% | 100.0% |
| Range | 48.5% | 50.3% |
| Mean | 77.7% | 85.3% |
| Median | 80.5% | 84.7% |
| Interquartile 25% (IQ1) | 70.6% | 83.0% |
| Interquartile 75% (IQ3) | 83.6% | 87.5% |
| Interquartile Range (IQR) | 13.0% | 4.5% |
| Standard Deviation (Sample) | 11.2% | 8.0% |
| Standard Deviation (Population) | 11.0% | 8.0% |
Similar Demographics by In Labor Force | Age 45-54
Demographics Similar to Cree by In Labor Force | Age 45-54
In terms of in labor force | age 45-54, the demographic groups most similar to Cree are Vietnamese (80.8%, a difference of 0.0%), Delaware (80.8%, a difference of 0.010%), Immigrants from Dominica (80.8%, a difference of 0.010%), Belizean (80.8%, a difference of 0.020%), and Immigrants from Bangladesh (80.7%, a difference of 0.030%).
| Demographics | Rating | Rank | In Labor Force | Age 45-54 |
| Immigrants | Grenada | 0.0 /100 | #281 | Tragic 81.0% |
| Aleuts | 0.0 /100 | #282 | Tragic 81.0% |
| French American Indians | 0.0 /100 | #283 | Tragic 80.8% |
| Belizeans | 0.0 /100 | #284 | Tragic 80.8% |
| Delaware | 0.0 /100 | #285 | Tragic 80.8% |
| Immigrants | Dominica | 0.0 /100 | #286 | Tragic 80.8% |
| Vietnamese | 0.0 /100 | #287 | Tragic 80.8% |
| Cree | 0.0 /100 | #288 | Tragic 80.8% |
| Immigrants | Bangladesh | 0.0 /100 | #289 | Tragic 80.7% |
| Mexican American Indians | 0.0 /100 | #290 | Tragic 80.7% |
| Immigrants | Belize | 0.0 /100 | #291 | Tragic 80.6% |
| Iroquois | 0.0 /100 | #292 | Tragic 80.6% |
| Osage | 0.0 /100 | #293 | Tragic 80.6% |
| Yakama | 0.0 /100 | #294 | Tragic 80.6% |
| Nepalese | 0.0 /100 | #295 | Tragic 80.5% |
Demographics Similar to Immigrants from Eastern Africa by In Labor Force | Age 45-54
In terms of in labor force | age 45-54, the demographic groups most similar to Immigrants from Eastern Africa are Immigrants from Sri Lanka (83.9%, a difference of 0.0%), Immigrants from Ireland (83.9%, a difference of 0.0%), Czech (83.9%, a difference of 0.010%), Tlingit-Haida (83.9%, a difference of 0.010%), and Slovene (83.9%, a difference of 0.010%).
| Demographics | Rating | Rank | In Labor Force | Age 45-54 |
| Chinese | 99.9 /100 | #13 | Exceptional 84.1% |
| Cambodians | 99.9 /100 | #14 | Exceptional 84.1% |
| Cypriots | 99.9 /100 | #15 | Exceptional 84.1% |
| Immigrants | Nepal | 99.9 /100 | #16 | Exceptional 84.0% |
| Zimbabweans | 99.9 /100 | #17 | Exceptional 84.0% |
| Immigrants | South Central Asia | 99.9 /100 | #18 | Exceptional 84.0% |
| Czechs | 99.8 /100 | #19 | Exceptional 83.9% |
| Immigrants | Eastern Africa | 99.8 /100 | #20 | Exceptional 83.9% |
| Immigrants | Sri Lanka | 99.8 /100 | #21 | Exceptional 83.9% |
| Immigrants | Ireland | 99.8 /100 | #22 | Exceptional 83.9% |
| Tlingit-Haida | 99.8 /100 | #23 | Exceptional 83.9% |
| Slovenes | 99.8 /100 | #24 | Exceptional 83.9% |
| Immigrants | North Macedonia | 99.8 /100 | #25 | Exceptional 83.9% |
| Immigrants | Serbia | 99.8 /100 | #26 | Exceptional 83.9% |
| Immigrants | Brazil | 99.8 /100 | #27 | Exceptional 83.9% |