Immigrants from Barbados vs Immigrants from Austria In Labor Force | Age 25-29
COMPARE
Immigrants from Barbados
Immigrants from Austria
In Labor Force | Age 25-29
In Labor Force | Age 25-29 Comparison
Immigrants from Barbados
Immigrants from Austria
83.4%
IN LABOR FORCE | AGE 25-29
0.0/ 100
METRIC RATING
269th/ 347
METRIC RANK
85.0%
IN LABOR FORCE | AGE 25-29
91.9/ 100
METRIC RATING
108th/ 347
METRIC RANK
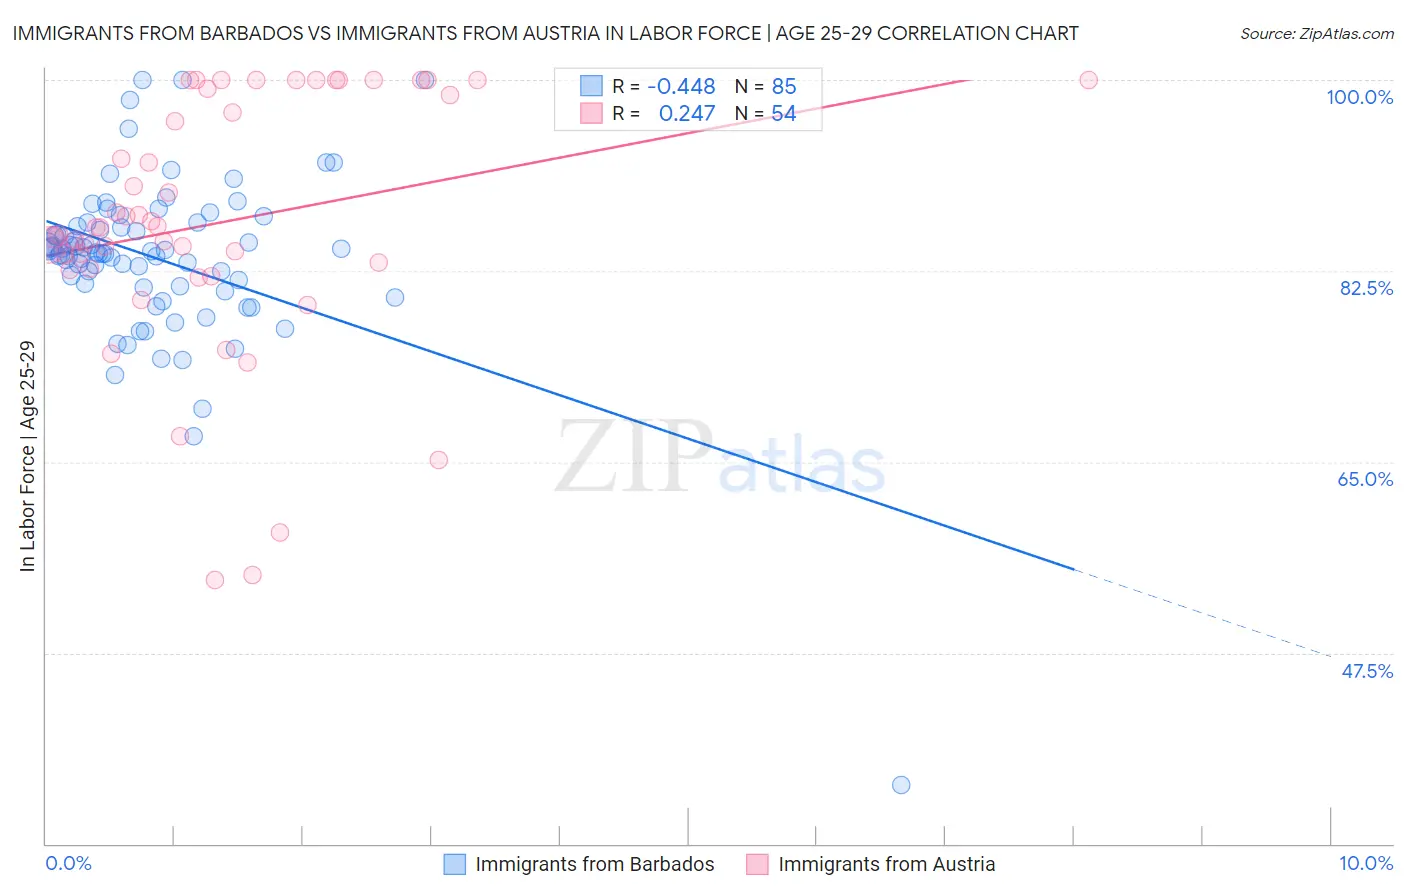
Immigrants from Barbados vs Immigrants from Austria In Labor Force | Age 25-29 Correlation Chart
The statistical analysis conducted on geographies consisting of 112,776,614 people shows a moderate negative correlation between the proportion of Immigrants from Barbados and labor force participation rate among population between the ages 25 and 29 in the United States with a correlation coefficient (R) of -0.448 and weighted average of 83.4%. Similarly, the statistical analysis conducted on geographies consisting of 167,922,363 people shows a weak positive correlation between the proportion of Immigrants from Austria and labor force participation rate among population between the ages 25 and 29 in the United States with a correlation coefficient (R) of 0.247 and weighted average of 85.0%, a difference of 1.9%.
In Labor Force | Age 25-29 Correlation Summary
| Measurement | Immigrants from Barbados | Immigrants from Austria |
| Minimum | 35.4% | 54.2% |
| Maximum | 100.0% | 100.0% |
| Range | 64.6% | 45.8% |
| Mean | 83.6% | 87.0% |
| Median | 84.2% | 86.5% |
| Interquartile 25% (IQ1) | 81.1% | 82.7% |
| Interquartile 75% (IQ3) | 86.8% | 99.2% |
| Interquartile Range (IQR) | 5.7% | 16.4% |
| Standard Deviation (Sample) | 8.0% | 11.7% |
| Standard Deviation (Population) | 7.9% | 11.6% |
Similar Demographics by In Labor Force | Age 25-29
Demographics Similar to Immigrants from Barbados by In Labor Force | Age 25-29
In terms of in labor force | age 25-29, the demographic groups most similar to Immigrants from Barbados are Immigrants from Lebanon (83.4%, a difference of 0.0%), Spanish American (83.4%, a difference of 0.010%), Basque (83.4%, a difference of 0.010%), Aleut (83.4%, a difference of 0.020%), and Honduran (83.4%, a difference of 0.040%).
| Demographics | Rating | Rank | In Labor Force | Age 25-29 |
| Immigrants | Fiji | 0.1 /100 | #262 | Tragic 83.6% |
| West Indians | 0.1 /100 | #263 | Tragic 83.5% |
| Puget Sound Salish | 0.1 /100 | #264 | Tragic 83.5% |
| Cubans | 0.1 /100 | #265 | Tragic 83.5% |
| Aleuts | 0.0 /100 | #266 | Tragic 83.4% |
| Spanish Americans | 0.0 /100 | #267 | Tragic 83.4% |
| Immigrants | Lebanon | 0.0 /100 | #268 | Tragic 83.4% |
| Immigrants | Barbados | 0.0 /100 | #269 | Tragic 83.4% |
| Basques | 0.0 /100 | #270 | Tragic 83.4% |
| Hondurans | 0.0 /100 | #271 | Tragic 83.4% |
| Immigrants | Caribbean | 0.0 /100 | #272 | Tragic 83.4% |
| Immigrants | Dominica | 0.0 /100 | #273 | Tragic 83.4% |
| Marshallese | 0.0 /100 | #274 | Tragic 83.3% |
| Samoans | 0.0 /100 | #275 | Tragic 83.3% |
| Immigrants | Honduras | 0.0 /100 | #276 | Tragic 83.3% |
Demographics Similar to Immigrants from Austria by In Labor Force | Age 25-29
In terms of in labor force | age 25-29, the demographic groups most similar to Immigrants from Austria are Costa Rican (85.0%, a difference of 0.0%), Immigrants from Southern Europe (85.0%, a difference of 0.010%), New Zealander (85.0%, a difference of 0.010%), Immigrants from Middle Africa (85.0%, a difference of 0.010%), and Immigrants from Hong Kong (85.0%, a difference of 0.020%).
| Demographics | Rating | Rank | In Labor Force | Age 25-29 |
| Egyptians | 93.8 /100 | #101 | Exceptional 85.1% |
| Slavs | 93.7 /100 | #102 | Exceptional 85.1% |
| Immigrants | Japan | 93.5 /100 | #103 | Exceptional 85.1% |
| Immigrants | Zaire | 93.3 /100 | #104 | Exceptional 85.1% |
| Immigrants | Hong Kong | 92.8 /100 | #105 | Exceptional 85.0% |
| Czechoslovakians | 92.6 /100 | #106 | Exceptional 85.0% |
| Immigrants | Southern Europe | 92.3 /100 | #107 | Exceptional 85.0% |
| Immigrants | Austria | 91.9 /100 | #108 | Exceptional 85.0% |
| Costa Ricans | 91.9 /100 | #109 | Exceptional 85.0% |
| New Zealanders | 91.5 /100 | #110 | Exceptional 85.0% |
| Immigrants | Middle Africa | 91.4 /100 | #111 | Exceptional 85.0% |
| Senegalese | 90.9 /100 | #112 | Exceptional 85.0% |
| Irish | 90.6 /100 | #113 | Exceptional 85.0% |
| Immigrants | Malaysia | 90.4 /100 | #114 | Exceptional 85.0% |
| South Africans | 88.9 /100 | #115 | Excellent 85.0% |