Belizean vs Immigrants from Jordan In Labor Force | Age 25-29
COMPARE
Belizean
Immigrants from Jordan
In Labor Force | Age 25-29
In Labor Force | Age 25-29 Comparison
Belizeans
Immigrants from Jordan
83.1%
IN LABOR FORCE | AGE 25-29
0.0/ 100
METRIC RATING
285th/ 347
METRIC RANK
84.4%
IN LABOR FORCE | AGE 25-29
12.8/ 100
METRIC RATING
209th/ 347
METRIC RANK
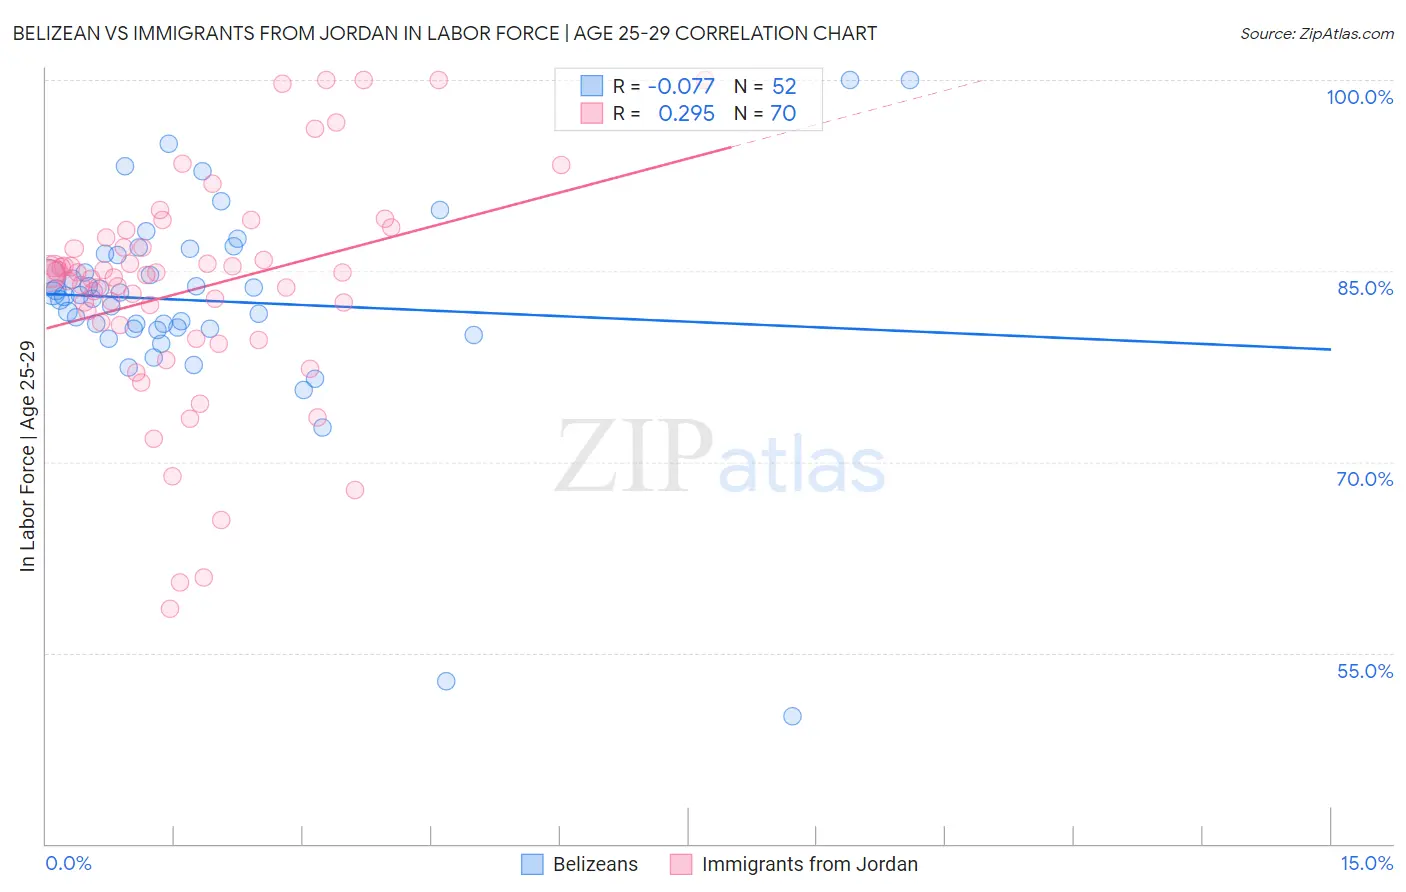
Belizean vs Immigrants from Jordan In Labor Force | Age 25-29 Correlation Chart
The statistical analysis conducted on geographies consisting of 144,200,012 people shows a slight negative correlation between the proportion of Belizeans and labor force participation rate among population between the ages 25 and 29 in the United States with a correlation coefficient (R) of -0.077 and weighted average of 83.1%. Similarly, the statistical analysis conducted on geographies consisting of 181,276,232 people shows a weak positive correlation between the proportion of Immigrants from Jordan and labor force participation rate among population between the ages 25 and 29 in the United States with a correlation coefficient (R) of 0.295 and weighted average of 84.4%, a difference of 1.5%.
In Labor Force | Age 25-29 Correlation Summary
| Measurement | Belizean | Immigrants from Jordan |
| Minimum | 50.0% | 58.5% |
| Maximum | 100.0% | 100.0% |
| Range | 50.0% | 41.5% |
| Mean | 82.6% | 83.6% |
| Median | 83.1% | 84.7% |
| Interquartile 25% (IQ1) | 80.5% | 80.7% |
| Interquartile 75% (IQ3) | 86.3% | 86.9% |
| Interquartile Range (IQR) | 5.8% | 6.2% |
| Standard Deviation (Sample) | 8.3% | 8.8% |
| Standard Deviation (Population) | 8.2% | 8.7% |
Similar Demographics by In Labor Force | Age 25-29
Demographics Similar to Belizeans by In Labor Force | Age 25-29
In terms of in labor force | age 25-29, the demographic groups most similar to Belizeans are Mexican American Indian (83.0%, a difference of 0.020%), Nicaraguan (83.1%, a difference of 0.030%), Guyanese (83.0%, a difference of 0.030%), American (83.1%, a difference of 0.060%), and Immigrants from the Azores (83.1%, a difference of 0.060%).
| Demographics | Rating | Rank | In Labor Force | Age 25-29 |
| Immigrants | Cuba | 0.0 /100 | #278 | Tragic 83.2% |
| British West Indians | 0.0 /100 | #279 | Tragic 83.2% |
| Dominicans | 0.0 /100 | #280 | Tragic 83.2% |
| Immigrants | Dominican Republic | 0.0 /100 | #281 | Tragic 83.1% |
| Americans | 0.0 /100 | #282 | Tragic 83.1% |
| Immigrants | Azores | 0.0 /100 | #283 | Tragic 83.1% |
| Nicaraguans | 0.0 /100 | #284 | Tragic 83.1% |
| Belizeans | 0.0 /100 | #285 | Tragic 83.1% |
| Mexican American Indians | 0.0 /100 | #286 | Tragic 83.0% |
| Guyanese | 0.0 /100 | #287 | Tragic 83.0% |
| Ottawa | 0.0 /100 | #288 | Tragic 83.0% |
| Immigrants | Micronesia | 0.0 /100 | #289 | Tragic 83.0% |
| Immigrants | Bangladesh | 0.0 /100 | #290 | Tragic 83.0% |
| Hawaiians | 0.0 /100 | #291 | Tragic 83.0% |
| Immigrants | Guyana | 0.0 /100 | #292 | Tragic 83.0% |
Demographics Similar to Immigrants from Jordan by In Labor Force | Age 25-29
In terms of in labor force | age 25-29, the demographic groups most similar to Immigrants from Jordan are Chinese (84.3%, a difference of 0.0%), Immigrants from Venezuela (84.3%, a difference of 0.0%), Immigrants from Armenia (84.4%, a difference of 0.010%), Immigrants from Indonesia (84.4%, a difference of 0.010%), and Immigrants from Cambodia (84.4%, a difference of 0.020%).
| Demographics | Rating | Rank | In Labor Force | Age 25-29 |
| Afghans | 15.9 /100 | #202 | Poor 84.4% |
| Immigrants | Afghanistan | 15.6 /100 | #203 | Poor 84.4% |
| Venezuelans | 15.1 /100 | #204 | Poor 84.4% |
| Ecuadorians | 14.8 /100 | #205 | Poor 84.4% |
| Immigrants | Cambodia | 14.3 /100 | #206 | Poor 84.4% |
| Immigrants | Armenia | 13.3 /100 | #207 | Poor 84.4% |
| Immigrants | Indonesia | 13.2 /100 | #208 | Poor 84.4% |
| Immigrants | Jordan | 12.8 /100 | #209 | Poor 84.4% |
| Chinese | 12.7 /100 | #210 | Poor 84.3% |
| Immigrants | Venezuela | 12.6 /100 | #211 | Poor 84.3% |
| Sub-Saharan Africans | 11.7 /100 | #212 | Poor 84.3% |
| Japanese | 11.4 /100 | #213 | Poor 84.3% |
| Lebanese | 11.1 /100 | #214 | Poor 84.3% |
| Immigrants | Syria | 10.7 /100 | #215 | Poor 84.3% |
| Israelis | 9.3 /100 | #216 | Tragic 84.3% |