Immigrants from Pakistan vs Immigrants from Jordan In Labor Force | Age 25-29
COMPARE
Immigrants from Pakistan
Immigrants from Jordan
In Labor Force | Age 25-29
In Labor Force | Age 25-29 Comparison
Immigrants from Pakistan
Immigrants from Jordan
84.7%
IN LABOR FORCE | AGE 25-29
62.7/ 100
METRIC RATING
152nd/ 347
METRIC RANK
84.4%
IN LABOR FORCE | AGE 25-29
12.8/ 100
METRIC RATING
209th/ 347
METRIC RANK
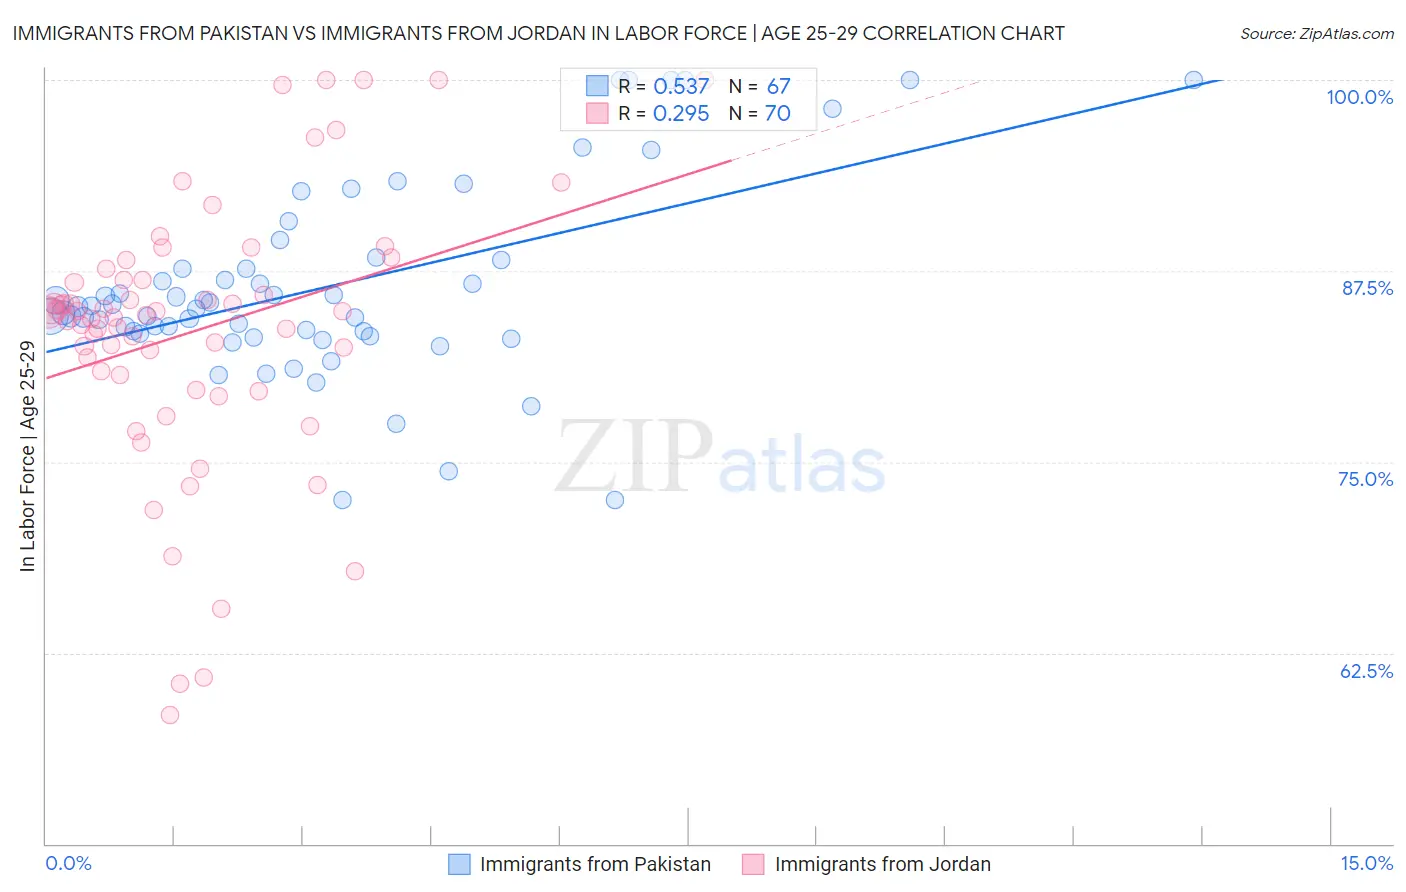
Immigrants from Pakistan vs Immigrants from Jordan In Labor Force | Age 25-29 Correlation Chart
The statistical analysis conducted on geographies consisting of 283,880,757 people shows a substantial positive correlation between the proportion of Immigrants from Pakistan and labor force participation rate among population between the ages 25 and 29 in the United States with a correlation coefficient (R) of 0.537 and weighted average of 84.7%. Similarly, the statistical analysis conducted on geographies consisting of 181,276,232 people shows a weak positive correlation between the proportion of Immigrants from Jordan and labor force participation rate among population between the ages 25 and 29 in the United States with a correlation coefficient (R) of 0.295 and weighted average of 84.4%, a difference of 0.45%.
In Labor Force | Age 25-29 Correlation Summary
| Measurement | Immigrants from Pakistan | Immigrants from Jordan |
| Minimum | 72.5% | 58.5% |
| Maximum | 100.0% | 100.0% |
| Range | 27.5% | 41.5% |
| Mean | 86.4% | 83.6% |
| Median | 85.2% | 84.7% |
| Interquartile 25% (IQ1) | 83.4% | 80.7% |
| Interquartile 75% (IQ3) | 88.2% | 86.9% |
| Interquartile Range (IQR) | 4.8% | 6.2% |
| Standard Deviation (Sample) | 6.3% | 8.8% |
| Standard Deviation (Population) | 6.3% | 8.7% |
Similar Demographics by In Labor Force | Age 25-29
Demographics Similar to Immigrants from Pakistan by In Labor Force | Age 25-29
In terms of in labor force | age 25-29, the demographic groups most similar to Immigrants from Pakistan are Colombian (84.7%, a difference of 0.0%), Immigrants from Taiwan (84.7%, a difference of 0.0%), Immigrants from Sri Lanka (84.7%, a difference of 0.010%), Indian (Asian) (84.7%, a difference of 0.010%), and French (84.7%, a difference of 0.010%).
| Demographics | Rating | Rank | In Labor Force | Age 25-29 |
| Immigrants | Senegal | 68.3 /100 | #145 | Good 84.8% |
| Icelanders | 68.2 /100 | #146 | Good 84.8% |
| Immigrants | Asia | 68.2 /100 | #147 | Good 84.8% |
| Immigrants | England | 65.2 /100 | #148 | Good 84.7% |
| Peruvians | 64.7 /100 | #149 | Good 84.7% |
| Swiss | 64.7 /100 | #150 | Good 84.7% |
| Colombians | 62.8 /100 | #151 | Good 84.7% |
| Immigrants | Pakistan | 62.7 /100 | #152 | Good 84.7% |
| Immigrants | Taiwan | 62.2 /100 | #153 | Good 84.7% |
| Immigrants | Sri Lanka | 61.7 /100 | #154 | Good 84.7% |
| Indians (Asian) | 61.6 /100 | #155 | Good 84.7% |
| French | 61.0 /100 | #156 | Good 84.7% |
| British | 60.4 /100 | #157 | Good 84.7% |
| Immigrants | Ghana | 60.2 /100 | #158 | Good 84.7% |
| Immigrants | Western Africa | 60.1 /100 | #159 | Good 84.7% |
Demographics Similar to Immigrants from Jordan by In Labor Force | Age 25-29
In terms of in labor force | age 25-29, the demographic groups most similar to Immigrants from Jordan are Chinese (84.3%, a difference of 0.0%), Immigrants from Venezuela (84.3%, a difference of 0.0%), Immigrants from Armenia (84.4%, a difference of 0.010%), Immigrants from Indonesia (84.4%, a difference of 0.010%), and Immigrants from Cambodia (84.4%, a difference of 0.020%).
| Demographics | Rating | Rank | In Labor Force | Age 25-29 |
| Afghans | 15.9 /100 | #202 | Poor 84.4% |
| Immigrants | Afghanistan | 15.6 /100 | #203 | Poor 84.4% |
| Venezuelans | 15.1 /100 | #204 | Poor 84.4% |
| Ecuadorians | 14.8 /100 | #205 | Poor 84.4% |
| Immigrants | Cambodia | 14.3 /100 | #206 | Poor 84.4% |
| Immigrants | Armenia | 13.3 /100 | #207 | Poor 84.4% |
| Immigrants | Indonesia | 13.2 /100 | #208 | Poor 84.4% |
| Immigrants | Jordan | 12.8 /100 | #209 | Poor 84.4% |
| Chinese | 12.7 /100 | #210 | Poor 84.3% |
| Immigrants | Venezuela | 12.6 /100 | #211 | Poor 84.3% |
| Sub-Saharan Africans | 11.7 /100 | #212 | Poor 84.3% |
| Japanese | 11.4 /100 | #213 | Poor 84.3% |
| Lebanese | 11.1 /100 | #214 | Poor 84.3% |
| Immigrants | Syria | 10.7 /100 | #215 | Poor 84.3% |
| Israelis | 9.3 /100 | #216 | Tragic 84.3% |