Immigrants from the Azores vs Immigrants from Japan In Labor Force | Age 20-24
COMPARE
Immigrants from the Azores
Immigrants from Japan
In Labor Force | Age 20-24
In Labor Force | Age 20-24 Comparison
Immigrants from the Azores
Immigrants from Japan
77.2%
IN LABOR FORCE | AGE 20-24
100.0/ 100
METRIC RATING
53rd/ 347
METRIC RANK
74.1%
IN LABOR FORCE | AGE 20-24
3.0/ 100
METRIC RATING
238th/ 347
METRIC RANK
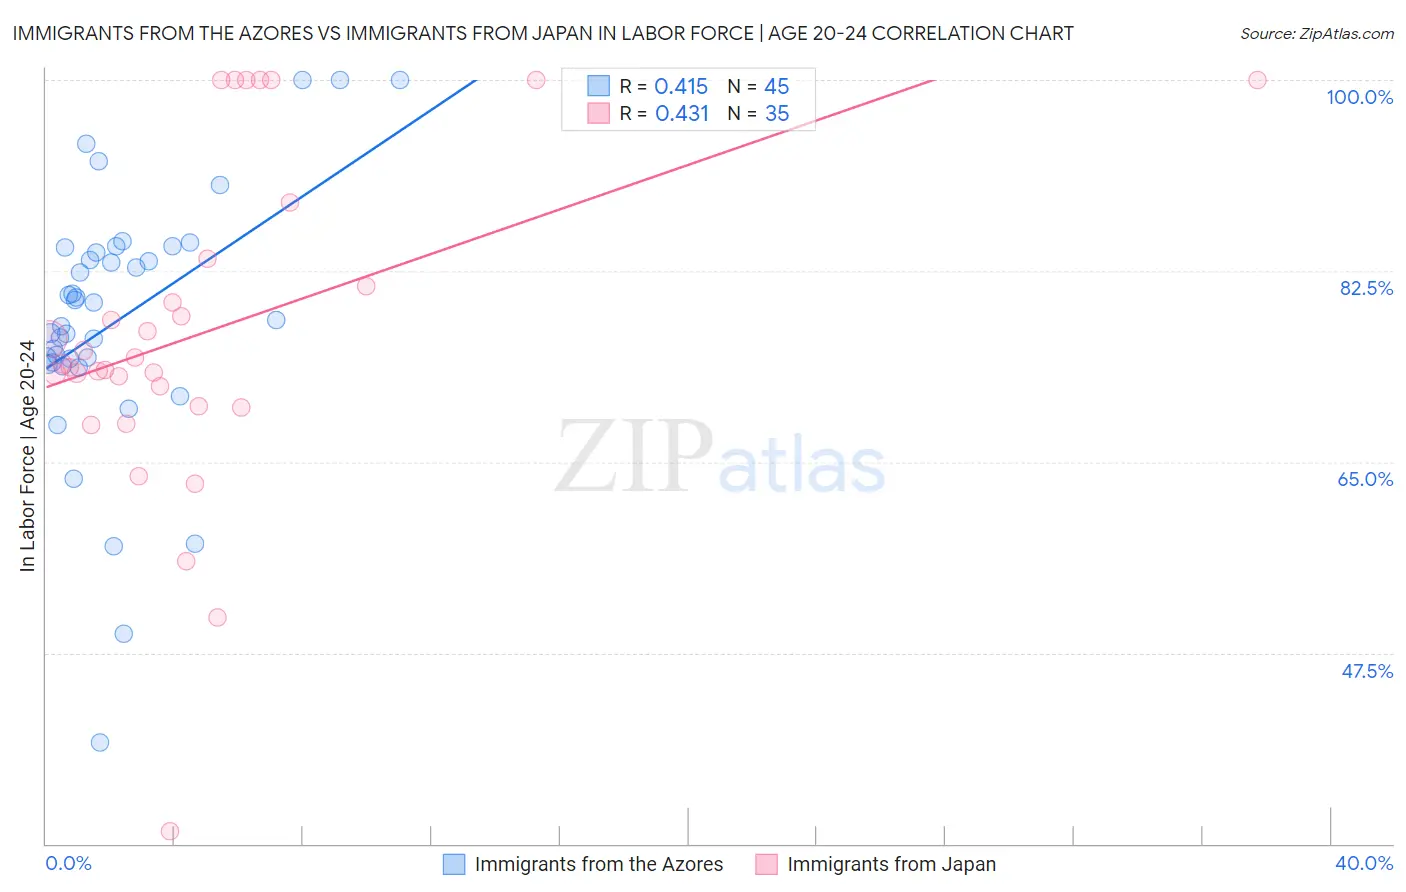
Immigrants from the Azores vs Immigrants from Japan In Labor Force | Age 20-24 Correlation Chart
The statistical analysis conducted on geographies consisting of 46,250,012 people shows a moderate positive correlation between the proportion of Immigrants from the Azores and labor force participation rate among population between the ages 20 and 24 in the United States with a correlation coefficient (R) of 0.415 and weighted average of 77.2%. Similarly, the statistical analysis conducted on geographies consisting of 340,014,549 people shows a moderate positive correlation between the proportion of Immigrants from Japan and labor force participation rate among population between the ages 20 and 24 in the United States with a correlation coefficient (R) of 0.431 and weighted average of 74.1%, a difference of 4.2%.
In Labor Force | Age 20-24 Correlation Summary
| Measurement | Immigrants from the Azores | Immigrants from Japan |
| Minimum | 39.3% | 31.2% |
| Maximum | 100.0% | 100.0% |
| Range | 60.7% | 68.8% |
| Mean | 78.0% | 76.9% |
| Median | 78.0% | 74.0% |
| Interquartile 25% (IQ1) | 74.0% | 70.1% |
| Interquartile 75% (IQ3) | 84.4% | 83.6% |
| Interquartile Range (IQR) | 10.4% | 13.5% |
| Standard Deviation (Sample) | 11.9% | 15.3% |
| Standard Deviation (Population) | 11.8% | 15.0% |
Similar Demographics by In Labor Force | Age 20-24
Demographics Similar to Immigrants from the Azores by In Labor Force | Age 20-24
In terms of in labor force | age 20-24, the demographic groups most similar to Immigrants from the Azores are Indonesian (77.2%, a difference of 0.010%), Croatian (77.2%, a difference of 0.020%), Malaysian (77.2%, a difference of 0.030%), Chinese (77.3%, a difference of 0.070%), and Serbian (77.3%, a difference of 0.080%).
| Demographics | Rating | Rank | In Labor Force | Age 20-24 |
| Samoans | 100.0 /100 | #46 | Exceptional 77.4% |
| Ethiopians | 100.0 /100 | #47 | Exceptional 77.3% |
| Serbians | 100.0 /100 | #48 | Exceptional 77.3% |
| Chinese | 100.0 /100 | #49 | Exceptional 77.3% |
| Malaysians | 100.0 /100 | #50 | Exceptional 77.2% |
| Croatians | 100.0 /100 | #51 | Exceptional 77.2% |
| Indonesians | 100.0 /100 | #52 | Exceptional 77.2% |
| Immigrants | Azores | 100.0 /100 | #53 | Exceptional 77.2% |
| Celtics | 99.9 /100 | #54 | Exceptional 77.1% |
| Immigrants | Liberia | 99.9 /100 | #55 | Exceptional 77.1% |
| Europeans | 99.9 /100 | #56 | Exceptional 77.1% |
| Chippewa | 99.9 /100 | #57 | Exceptional 77.1% |
| Hawaiians | 99.9 /100 | #58 | Exceptional 77.0% |
| Scotch-Irish | 99.9 /100 | #59 | Exceptional 77.0% |
| Kenyans | 99.9 /100 | #60 | Exceptional 77.0% |
Demographics Similar to Immigrants from Japan by In Labor Force | Age 20-24
In terms of in labor force | age 20-24, the demographic groups most similar to Immigrants from Japan are Bermudan (74.1%, a difference of 0.030%), Immigrants from France (74.1%, a difference of 0.040%), Immigrants from Latin America (74.1%, a difference of 0.040%), Laotian (74.1%, a difference of 0.060%), and Immigrants (74.1%, a difference of 0.070%).
| Demographics | Rating | Rank | In Labor Force | Age 20-24 |
| Immigrants | Greece | 4.1 /100 | #231 | Tragic 74.2% |
| Immigrants | Switzerland | 4.1 /100 | #232 | Tragic 74.2% |
| Immigrants | Chile | 3.7 /100 | #233 | Tragic 74.1% |
| Immigrants | Immigrants | 3.6 /100 | #234 | Tragic 74.1% |
| Laotians | 3.5 /100 | #235 | Tragic 74.1% |
| Immigrants | France | 3.3 /100 | #236 | Tragic 74.1% |
| Bermudans | 3.2 /100 | #237 | Tragic 74.1% |
| Immigrants | Japan | 3.0 /100 | #238 | Tragic 74.1% |
| Immigrants | Latin America | 2.7 /100 | #239 | Tragic 74.1% |
| Immigrants | Sri Lanka | 2.3 /100 | #240 | Tragic 74.0% |
| Immigrants | Senegal | 2.1 /100 | #241 | Tragic 74.0% |
| Thais | 2.1 /100 | #242 | Tragic 74.0% |
| Immigrants | Syria | 1.9 /100 | #243 | Tragic 74.0% |
| Immigrants | South Central Asia | 1.9 /100 | #244 | Tragic 74.0% |
| Turks | 1.8 /100 | #245 | Tragic 73.9% |