Immigrants from Trinidad and Tobago vs Immigrants from Guatemala In Labor Force | Age 20-64
COMPARE
Immigrants from Trinidad and Tobago
Immigrants from Guatemala
In Labor Force | Age 20-64
In Labor Force | Age 20-64 Comparison
Immigrants from Trinidad and Tobago
Immigrants from Guatemala
78.8%
IN LABOR FORCE | AGE 20-64
1.1/ 100
METRIC RATING
246th/ 347
METRIC RANK
78.7%
IN LABOR FORCE | AGE 20-64
0.4/ 100
METRIC RATING
258th/ 347
METRIC RANK
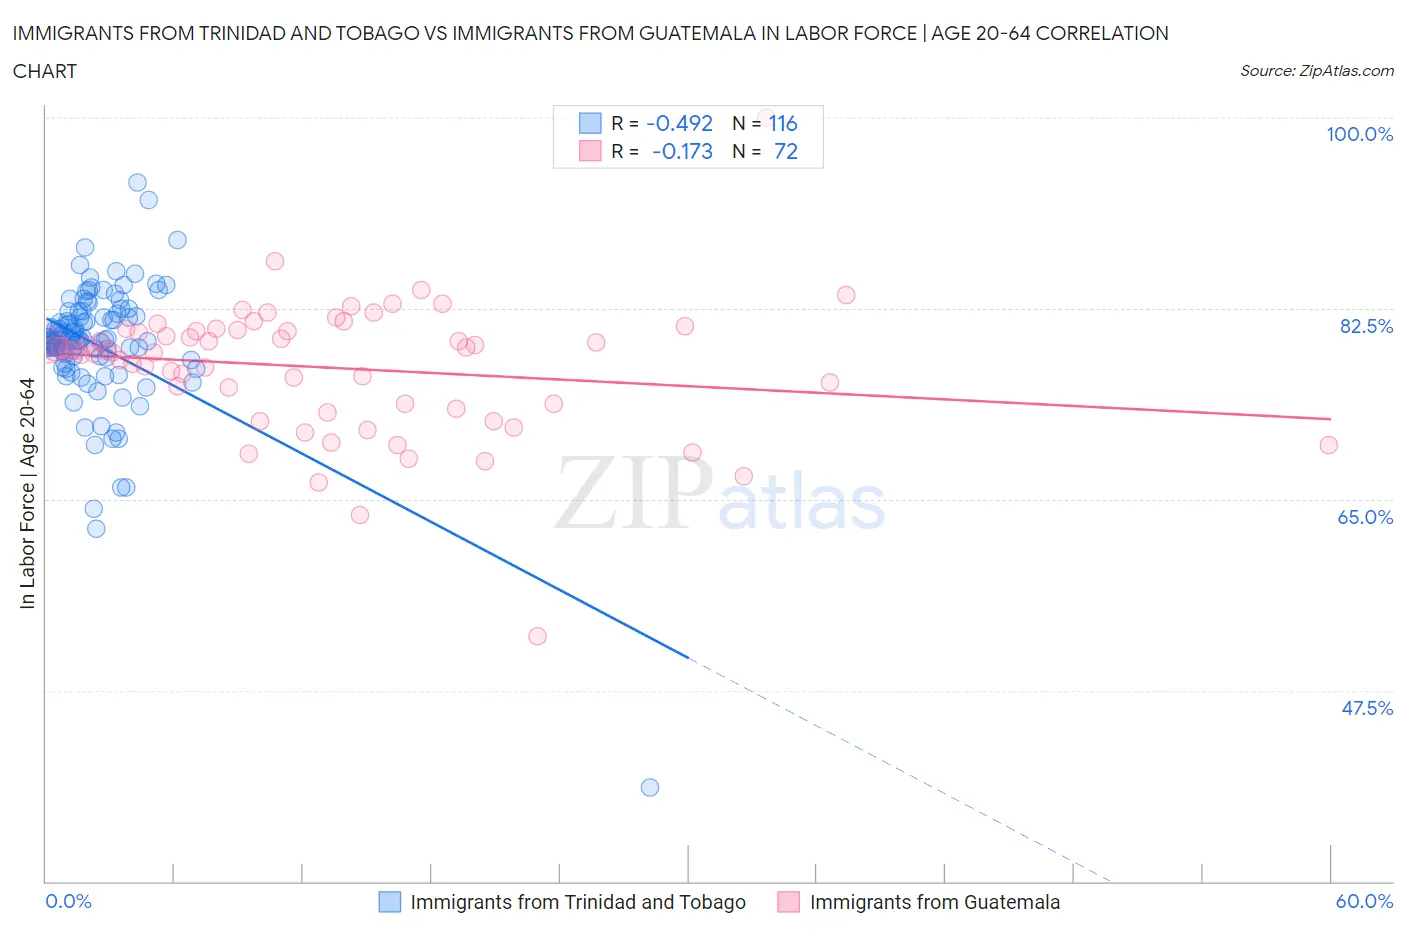
Immigrants from Trinidad and Tobago vs Immigrants from Guatemala In Labor Force | Age 20-64 Correlation Chart
The statistical analysis conducted on geographies consisting of 223,537,592 people shows a moderate negative correlation between the proportion of Immigrants from Trinidad and Tobago and labor force participation rate among population between the ages 20 and 64 in the United States with a correlation coefficient (R) of -0.492 and weighted average of 78.8%. Similarly, the statistical analysis conducted on geographies consisting of 377,275,045 people shows a poor negative correlation between the proportion of Immigrants from Guatemala and labor force participation rate among population between the ages 20 and 64 in the United States with a correlation coefficient (R) of -0.173 and weighted average of 78.7%, a difference of 0.19%.
In Labor Force | Age 20-64 Correlation Summary
| Measurement | Immigrants from Trinidad and Tobago | Immigrants from Guatemala |
| Minimum | 38.6% | 52.5% |
| Maximum | 94.0% | 100.0% |
| Range | 55.4% | 47.5% |
| Mean | 79.1% | 77.1% |
| Median | 79.6% | 78.6% |
| Interquartile 25% (IQ1) | 78.1% | 73.6% |
| Interquartile 75% (IQ3) | 81.7% | 80.5% |
| Interquartile Range (IQR) | 3.7% | 6.9% |
| Standard Deviation (Sample) | 6.1% | 6.2% |
| Standard Deviation (Population) | 6.1% | 6.2% |
Demographics Similar to Immigrants from Trinidad and Tobago and Immigrants from Guatemala by In Labor Force | Age 20-64
In terms of in labor force | age 20-64, the demographic groups most similar to Immigrants from Trinidad and Tobago are Immigrants from Germany (78.8%, a difference of 0.020%), Immigrants from Caribbean (78.8%, a difference of 0.020%), Scottish (78.9%, a difference of 0.030%), English (78.8%, a difference of 0.050%), and French (78.9%, a difference of 0.060%). Similarly, the demographic groups most similar to Immigrants from Guatemala are Guatemalan (78.7%, a difference of 0.0%), Hawaiian (78.7%, a difference of 0.020%), Celtic (78.7%, a difference of 0.020%), Tsimshian (78.7%, a difference of 0.030%), and Basque (78.7%, a difference of 0.040%).
| Demographics | Rating | Rank | In Labor Force | Age 20-64 |
| Immigrants | Micronesia | 1.9 /100 | #242 | Tragic 78.9% |
| Immigrants | West Indies | 1.7 /100 | #243 | Tragic 78.9% |
| French | 1.5 /100 | #244 | Tragic 78.9% |
| Scottish | 1.3 /100 | #245 | Tragic 78.9% |
| Immigrants | Trinidad and Tobago | 1.1 /100 | #246 | Tragic 78.8% |
| Immigrants | Germany | 1.0 /100 | #247 | Tragic 78.8% |
| Immigrants | Caribbean | 1.0 /100 | #248 | Tragic 78.8% |
| English | 0.9 /100 | #249 | Tragic 78.8% |
| Hondurans | 0.8 /100 | #250 | Tragic 78.8% |
| Barbadians | 0.7 /100 | #251 | Tragic 78.8% |
| Immigrants | Honduras | 0.6 /100 | #252 | Tragic 78.7% |
| Basques | 0.5 /100 | #253 | Tragic 78.7% |
| Immigrants | Lebanon | 0.5 /100 | #254 | Tragic 78.7% |
| Hawaiians | 0.5 /100 | #255 | Tragic 78.7% |
| Celtics | 0.5 /100 | #256 | Tragic 78.7% |
| Guatemalans | 0.4 /100 | #257 | Tragic 78.7% |
| Immigrants | Guatemala | 0.4 /100 | #258 | Tragic 78.7% |
| Tsimshian | 0.4 /100 | #259 | Tragic 78.7% |
| Immigrants | Fiji | 0.3 /100 | #260 | Tragic 78.6% |
| Whites/Caucasians | 0.2 /100 | #261 | Tragic 78.5% |
| Fijians | 0.1 /100 | #262 | Tragic 78.4% |