Immigrants from the Azores vs German In Labor Force | Age 25-29
COMPARE
Immigrants from the Azores
German
In Labor Force | Age 25-29
In Labor Force | Age 25-29 Comparison
Immigrants from the Azores
Germans
83.1%
IN LABOR FORCE | AGE 25-29
0.0/ 100
METRIC RATING
283rd/ 347
METRIC RANK
85.3%
IN LABOR FORCE | AGE 25-29
98.1/ 100
METRIC RATING
76th/ 347
METRIC RANK
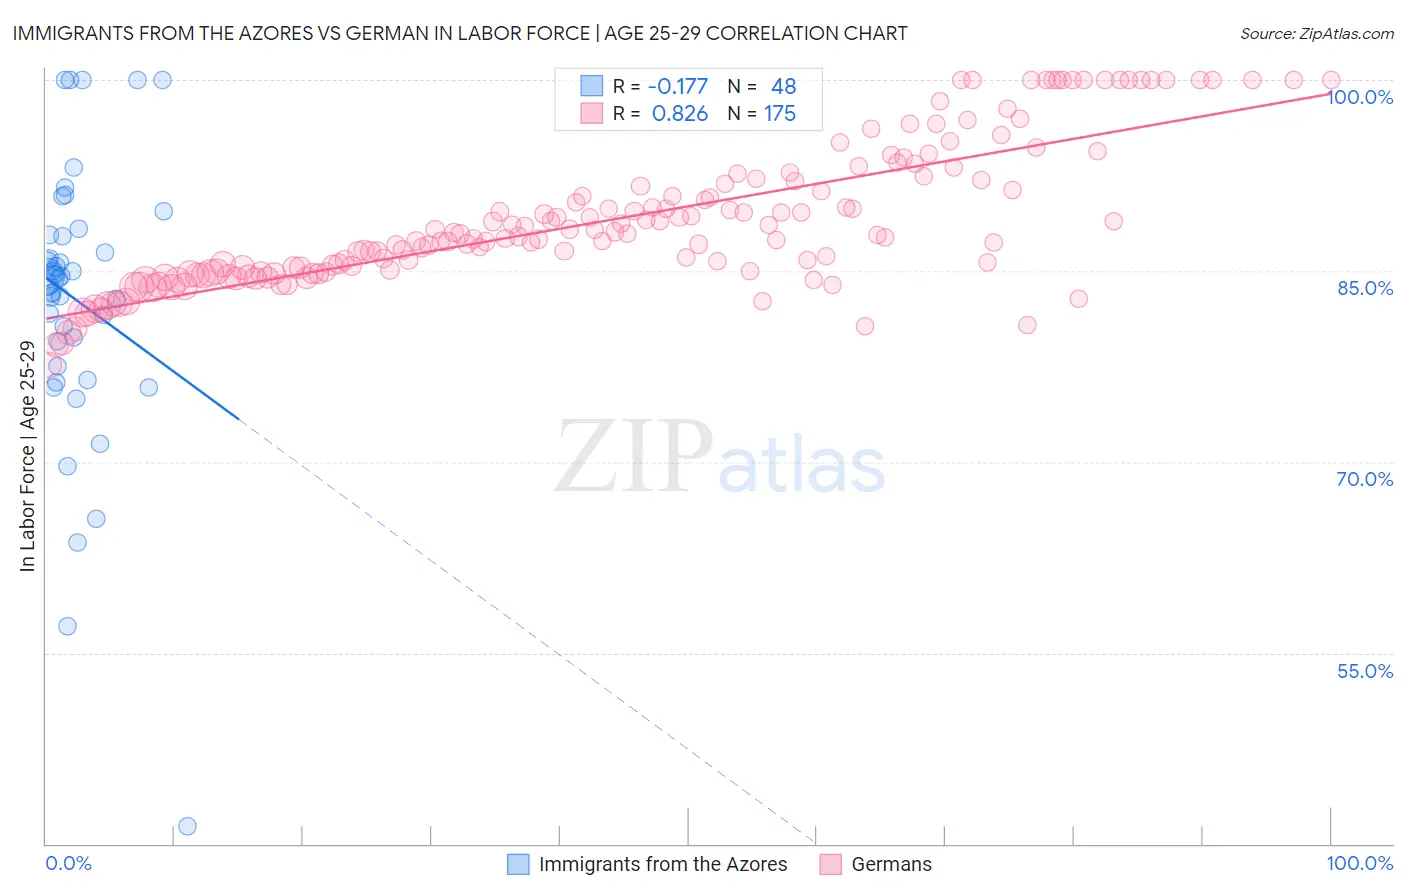
Immigrants from the Azores vs German In Labor Force | Age 25-29 Correlation Chart
The statistical analysis conducted on geographies consisting of 46,246,668 people shows a poor negative correlation between the proportion of Immigrants from the Azores and labor force participation rate among population between the ages 25 and 29 in the United States with a correlation coefficient (R) of -0.177 and weighted average of 83.1%. Similarly, the statistical analysis conducted on geographies consisting of 579,041,813 people shows a very strong positive correlation between the proportion of Germans and labor force participation rate among population between the ages 25 and 29 in the United States with a correlation coefficient (R) of 0.826 and weighted average of 85.3%, a difference of 2.6%.
In Labor Force | Age 25-29 Correlation Summary
| Measurement | Immigrants from the Azores | German |
| Minimum | 41.4% | 77.6% |
| Maximum | 100.0% | 100.0% |
| Range | 58.6% | 22.4% |
| Mean | 82.7% | 89.0% |
| Median | 84.5% | 87.7% |
| Interquartile 25% (IQ1) | 78.5% | 84.9% |
| Interquartile 75% (IQ3) | 87.8% | 92.2% |
| Interquartile Range (IQR) | 9.3% | 7.3% |
| Standard Deviation (Sample) | 10.9% | 5.5% |
| Standard Deviation (Population) | 10.8% | 5.5% |
Similar Demographics by In Labor Force | Age 25-29
Demographics Similar to Immigrants from the Azores by In Labor Force | Age 25-29
In terms of in labor force | age 25-29, the demographic groups most similar to Immigrants from the Azores are American (83.1%, a difference of 0.0%), Immigrants from Dominican Republic (83.1%, a difference of 0.010%), Nicaraguan (83.1%, a difference of 0.020%), Belizean (83.1%, a difference of 0.060%), and Dominican (83.2%, a difference of 0.070%).
| Demographics | Rating | Rank | In Labor Force | Age 25-29 |
| Immigrants | Honduras | 0.0 /100 | #276 | Tragic 83.3% |
| Africans | 0.0 /100 | #277 | Tragic 83.2% |
| Immigrants | Cuba | 0.0 /100 | #278 | Tragic 83.2% |
| British West Indians | 0.0 /100 | #279 | Tragic 83.2% |
| Dominicans | 0.0 /100 | #280 | Tragic 83.2% |
| Immigrants | Dominican Republic | 0.0 /100 | #281 | Tragic 83.1% |
| Americans | 0.0 /100 | #282 | Tragic 83.1% |
| Immigrants | Azores | 0.0 /100 | #283 | Tragic 83.1% |
| Nicaraguans | 0.0 /100 | #284 | Tragic 83.1% |
| Belizeans | 0.0 /100 | #285 | Tragic 83.1% |
| Mexican American Indians | 0.0 /100 | #286 | Tragic 83.0% |
| Guyanese | 0.0 /100 | #287 | Tragic 83.0% |
| Ottawa | 0.0 /100 | #288 | Tragic 83.0% |
| Immigrants | Micronesia | 0.0 /100 | #289 | Tragic 83.0% |
| Immigrants | Bangladesh | 0.0 /100 | #290 | Tragic 83.0% |
Demographics Similar to Germans by In Labor Force | Age 25-29
In terms of in labor force | age 25-29, the demographic groups most similar to Germans are Brazilian (85.3%, a difference of 0.020%), Immigrants from South Central Asia (85.2%, a difference of 0.020%), Immigrants from Egypt (85.2%, a difference of 0.030%), Immigrants from Northern Africa (85.2%, a difference of 0.040%), and Immigrants from Zimbabwe (85.2%, a difference of 0.040%).
| Demographics | Rating | Rank | In Labor Force | Age 25-29 |
| Menominee | 99.1 /100 | #69 | Exceptional 85.4% |
| Immigrants | Sweden | 99.1 /100 | #70 | Exceptional 85.4% |
| Kenyans | 99.0 /100 | #71 | Exceptional 85.4% |
| Immigrants | Australia | 98.9 /100 | #72 | Exceptional 85.3% |
| Russians | 98.8 /100 | #73 | Exceptional 85.3% |
| Soviet Union | 98.5 /100 | #74 | Exceptional 85.3% |
| Brazilians | 98.3 /100 | #75 | Exceptional 85.3% |
| Germans | 98.1 /100 | #76 | Exceptional 85.3% |
| Immigrants | South Central Asia | 97.9 /100 | #77 | Exceptional 85.2% |
| Immigrants | Egypt | 97.7 /100 | #78 | Exceptional 85.2% |
| Immigrants | Northern Africa | 97.6 /100 | #79 | Exceptional 85.2% |
| Immigrants | Zimbabwe | 97.6 /100 | #80 | Exceptional 85.2% |
| Immigrants | Northern Europe | 97.2 /100 | #81 | Exceptional 85.2% |
| Okinawans | 97.0 /100 | #82 | Exceptional 85.2% |
| Immigrants | Europe | 96.8 /100 | #83 | Exceptional 85.2% |