Immigrants from Austria vs Yaqui In Labor Force | Age 35-44
COMPARE
Immigrants from Austria
Yaqui
In Labor Force | Age 35-44
In Labor Force | Age 35-44 Comparison
Immigrants from Austria
Yaqui
84.4%
IN LABOR FORCE | AGE 35-44
63.8/ 100
METRIC RATING
157th/ 347
METRIC RANK
80.5%
IN LABOR FORCE | AGE 35-44
0.0/ 100
METRIC RATING
323rd/ 347
METRIC RANK
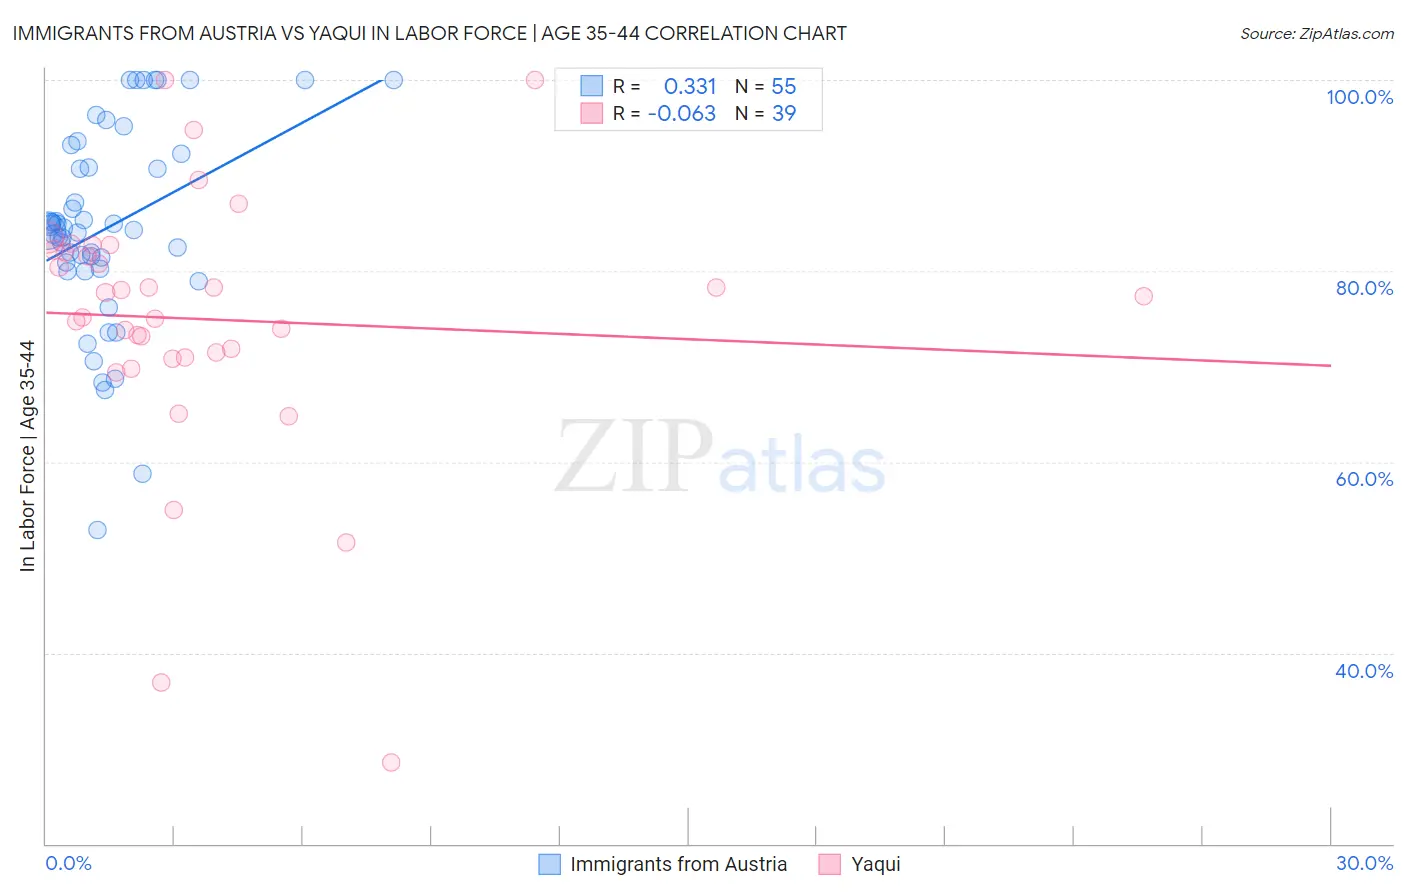
Immigrants from Austria vs Yaqui In Labor Force | Age 35-44 Correlation Chart
The statistical analysis conducted on geographies consisting of 167,953,357 people shows a mild positive correlation between the proportion of Immigrants from Austria and labor force participation rate among population between the ages 35 and 44 in the United States with a correlation coefficient (R) of 0.331 and weighted average of 84.4%. Similarly, the statistical analysis conducted on geographies consisting of 107,720,131 people shows a slight negative correlation between the proportion of Yaqui and labor force participation rate among population between the ages 35 and 44 in the United States with a correlation coefficient (R) of -0.063 and weighted average of 80.5%, a difference of 4.9%.
In Labor Force | Age 35-44 Correlation Summary
| Measurement | Immigrants from Austria | Yaqui |
| Minimum | 52.9% | 28.5% |
| Maximum | 100.0% | 100.0% |
| Range | 47.1% | 71.5% |
| Mean | 84.6% | 74.9% |
| Median | 84.3% | 77.3% |
| Interquartile 25% (IQ1) | 80.3% | 70.9% |
| Interquartile 75% (IQ3) | 92.3% | 82.2% |
| Interquartile Range (IQR) | 12.0% | 11.3% |
| Standard Deviation (Sample) | 10.5% | 14.0% |
| Standard Deviation (Population) | 10.4% | 13.8% |
Similar Demographics by In Labor Force | Age 35-44
Demographics Similar to Immigrants from Austria by In Labor Force | Age 35-44
In terms of in labor force | age 35-44, the demographic groups most similar to Immigrants from Austria are Immigrants from Israel (84.4%, a difference of 0.0%), Immigrants from Switzerland (84.5%, a difference of 0.010%), Jamaican (84.4%, a difference of 0.010%), Immigrants from Senegal (84.4%, a difference of 0.020%), and Immigrants from Kazakhstan (84.4%, a difference of 0.020%).
| Demographics | Rating | Rank | In Labor Force | Age 35-44 |
| Immigrants | Nigeria | 73.3 /100 | #150 | Good 84.5% |
| Romanians | 72.1 /100 | #151 | Good 84.5% |
| Immigrants | Taiwan | 71.4 /100 | #152 | Good 84.5% |
| Trinidadians and Tobagonians | 69.5 /100 | #153 | Good 84.5% |
| Iranians | 69.4 /100 | #154 | Good 84.5% |
| Immigrants | Switzerland | 65.9 /100 | #155 | Good 84.5% |
| Immigrants | Israel | 64.3 /100 | #156 | Good 84.4% |
| Immigrants | Austria | 63.8 /100 | #157 | Good 84.4% |
| Jamaicans | 62.7 /100 | #158 | Good 84.4% |
| Immigrants | Senegal | 60.4 /100 | #159 | Good 84.4% |
| Immigrants | Kazakhstan | 60.4 /100 | #160 | Good 84.4% |
| Immigrants | Venezuela | 60.0 /100 | #161 | Good 84.4% |
| Immigrants | Hungary | 59.4 /100 | #162 | Average 84.4% |
| Aleuts | 59.1 /100 | #163 | Average 84.4% |
| Nigerians | 58.9 /100 | #164 | Average 84.4% |
Demographics Similar to Yaqui by In Labor Force | Age 35-44
In terms of in labor force | age 35-44, the demographic groups most similar to Yaqui are Choctaw (80.5%, a difference of 0.010%), Paiute (80.6%, a difference of 0.11%), Dutch West Indian (80.4%, a difference of 0.16%), Puerto Rican (80.7%, a difference of 0.18%), and Seminole (80.4%, a difference of 0.20%).
| Demographics | Rating | Rank | In Labor Force | Age 35-44 |
| Comanche | 0.0 /100 | #316 | Tragic 81.5% |
| Cherokee | 0.0 /100 | #317 | Tragic 81.4% |
| Alaskan Athabascans | 0.0 /100 | #318 | Tragic 81.3% |
| Inupiat | 0.0 /100 | #319 | Tragic 80.9% |
| Chickasaw | 0.0 /100 | #320 | Tragic 80.9% |
| Puerto Ricans | 0.0 /100 | #321 | Tragic 80.7% |
| Paiute | 0.0 /100 | #322 | Tragic 80.6% |
| Yaqui | 0.0 /100 | #323 | Tragic 80.5% |
| Choctaw | 0.0 /100 | #324 | Tragic 80.5% |
| Dutch West Indians | 0.0 /100 | #325 | Tragic 80.4% |
| Seminole | 0.0 /100 | #326 | Tragic 80.4% |
| Sioux | 0.0 /100 | #327 | Tragic 80.2% |
| Creek | 0.0 /100 | #328 | Tragic 80.0% |
| Menominee | 0.0 /100 | #329 | Tragic 79.7% |
| Cheyenne | 0.0 /100 | #330 | Tragic 79.5% |