Immigrants from Austria vs Ethiopian In Labor Force | Age > 16
COMPARE
Immigrants from Austria
Ethiopian
In Labor Force | Age > 16
In Labor Force | Age > 16 Comparison
Immigrants from Austria
Ethiopians
63.9%
IN LABOR FORCE | AGE > 16
0.1/ 100
METRIC RATING
286th/ 347
METRIC RANK
69.3%
IN LABOR FORCE | AGE > 16
100.0/ 100
METRIC RATING
2nd/ 347
METRIC RANK
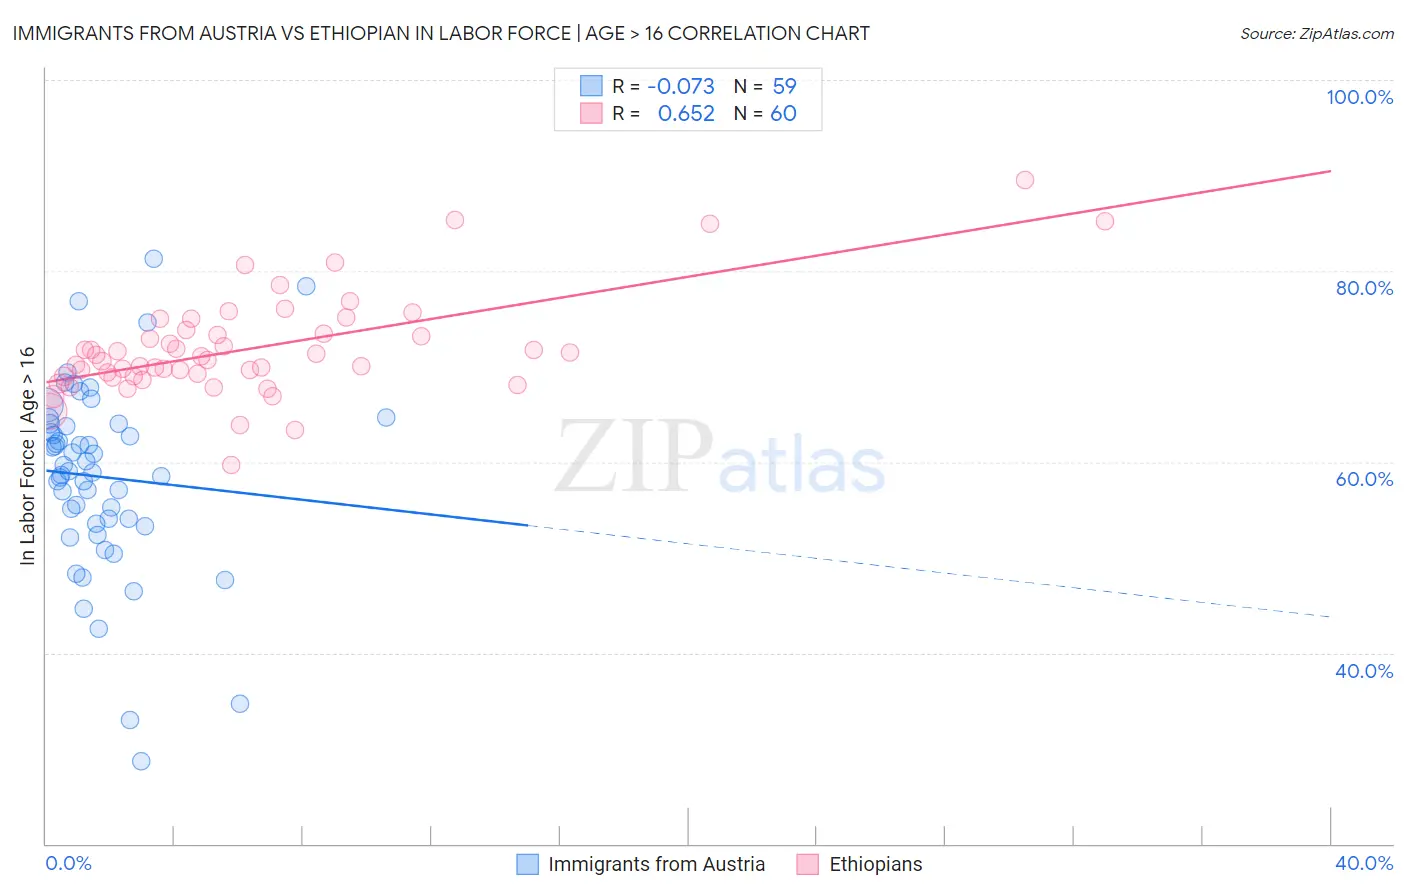
Immigrants from Austria vs Ethiopian In Labor Force | Age > 16 Correlation Chart
The statistical analysis conducted on geographies consisting of 167,973,659 people shows a slight negative correlation between the proportion of Immigrants from Austria and labor force participation rate among population ages 16 and over in the United States with a correlation coefficient (R) of -0.073 and weighted average of 63.9%. Similarly, the statistical analysis conducted on geographies consisting of 223,268,503 people shows a significant positive correlation between the proportion of Ethiopians and labor force participation rate among population ages 16 and over in the United States with a correlation coefficient (R) of 0.652 and weighted average of 69.3%, a difference of 8.5%.
In Labor Force | Age > 16 Correlation Summary
| Measurement | Immigrants from Austria | Ethiopian |
| Minimum | 28.7% | 59.7% |
| Maximum | 81.3% | 89.5% |
| Range | 52.6% | 29.8% |
| Mean | 58.4% | 71.9% |
| Median | 59.0% | 70.8% |
| Interquartile 25% (IQ1) | 53.5% | 69.0% |
| Interquartile 75% (IQ3) | 64.0% | 73.6% |
| Interquartile Range (IQR) | 10.5% | 4.6% |
| Standard Deviation (Sample) | 10.0% | 5.4% |
| Standard Deviation (Population) | 9.9% | 5.4% |
Similar Demographics by In Labor Force | Age > 16
Demographics Similar to Immigrants from Austria by In Labor Force | Age > 16
In terms of in labor force | age > 16, the demographic groups most similar to Immigrants from Austria are Scottish (63.9%, a difference of 0.0%), Slovak (63.9%, a difference of 0.030%), Spanish (63.9%, a difference of 0.050%), French (63.9%, a difference of 0.060%), and Immigrants from Germany (63.9%, a difference of 0.070%).
| Demographics | Rating | Rank | In Labor Force | Age > 16 |
| Welsh | 0.2 /100 | #279 | Tragic 64.0% |
| Immigrants | St. Vincent and the Grenadines | 0.2 /100 | #280 | Tragic 64.0% |
| French Canadians | 0.2 /100 | #281 | Tragic 64.0% |
| Immigrants | Guyana | 0.2 /100 | #282 | Tragic 64.0% |
| Immigrants | Germany | 0.1 /100 | #283 | Tragic 63.9% |
| French | 0.1 /100 | #284 | Tragic 63.9% |
| Slovaks | 0.1 /100 | #285 | Tragic 63.9% |
| Immigrants | Austria | 0.1 /100 | #286 | Tragic 63.9% |
| Scottish | 0.1 /100 | #287 | Tragic 63.9% |
| Spanish | 0.1 /100 | #288 | Tragic 63.9% |
| Celtics | 0.1 /100 | #289 | Tragic 63.8% |
| Hungarians | 0.1 /100 | #290 | Tragic 63.8% |
| Nepalese | 0.1 /100 | #291 | Tragic 63.8% |
| Spanish American Indians | 0.1 /100 | #292 | Tragic 63.8% |
| English | 0.1 /100 | #293 | Tragic 63.7% |
Demographics Similar to Ethiopians by In Labor Force | Age > 16
In terms of in labor force | age > 16, the demographic groups most similar to Ethiopians are Immigrants from Ethiopia (69.4%, a difference of 0.16%), Somali (69.2%, a difference of 0.20%), Immigrants from Somalia (69.1%, a difference of 0.27%), Sierra Leonean (68.9%, a difference of 0.58%), and Immigrants from Eritrea (68.9%, a difference of 0.63%).
| Demographics | Rating | Rank | In Labor Force | Age > 16 |
| Immigrants | Ethiopia | 100.0 /100 | #1 | Exceptional 69.4% |
| Ethiopians | 100.0 /100 | #2 | Exceptional 69.3% |
| Somalis | 100.0 /100 | #3 | Exceptional 69.2% |
| Immigrants | Somalia | 100.0 /100 | #4 | Exceptional 69.1% |
| Sierra Leoneans | 100.0 /100 | #5 | Exceptional 68.9% |
| Immigrants | Eritrea | 100.0 /100 | #6 | Exceptional 68.9% |
| Immigrants | Cameroon | 100.0 /100 | #7 | Exceptional 68.7% |
| Immigrants | Sierra Leone | 100.0 /100 | #8 | Exceptional 68.5% |
| Immigrants | Eastern Africa | 100.0 /100 | #9 | Exceptional 68.5% |
| Immigrants | Bolivia | 100.0 /100 | #10 | Exceptional 68.4% |
| Bolivians | 100.0 /100 | #11 | Exceptional 68.2% |
| Sudanese | 100.0 /100 | #12 | Exceptional 68.0% |
| Immigrants | Nepal | 100.0 /100 | #13 | Exceptional 68.0% |
| Liberians | 100.0 /100 | #14 | Exceptional 67.8% |
| Immigrants | Middle Africa | 100.0 /100 | #15 | Exceptional 67.7% |