Immigrants from Australia vs Celtic In Labor Force | Age 30-34
COMPARE
Immigrants from Australia
Celtic
In Labor Force | Age 30-34
In Labor Force | Age 30-34 Comparison
Immigrants from Australia
Celtics
85.6%
IN LABOR FORCE | AGE 30-34
99.8/ 100
METRIC RATING
50th/ 347
METRIC RANK
84.1%
IN LABOR FORCE | AGE 30-34
1.4/ 100
METRIC RATING
237th/ 347
METRIC RANK
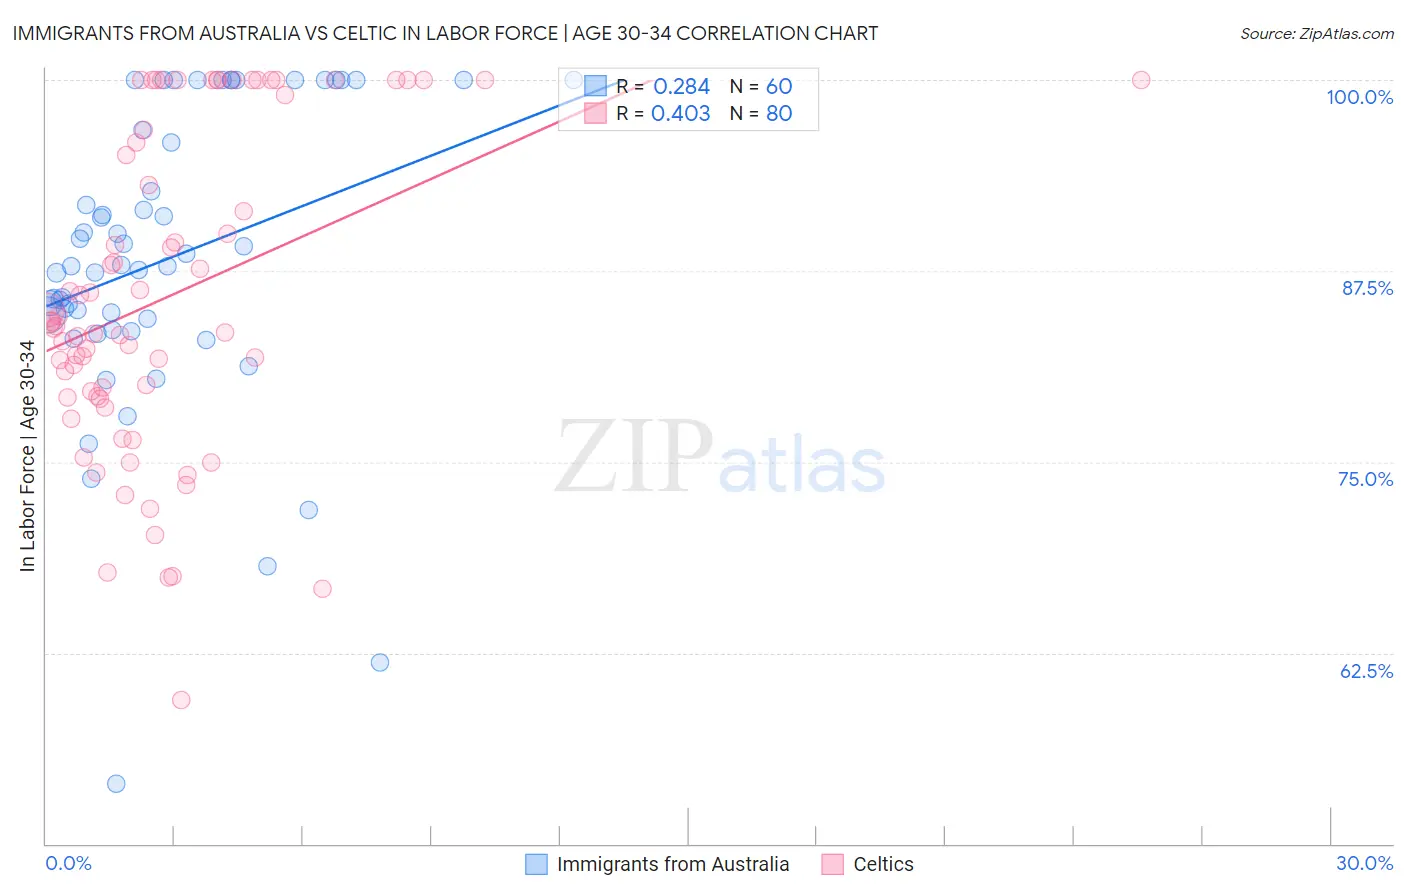
Immigrants from Australia vs Celtic In Labor Force | Age 30-34 Correlation Chart
The statistical analysis conducted on geographies consisting of 227,147,173 people shows a weak positive correlation between the proportion of Immigrants from Australia and labor force participation rate among population between the ages 30 and 34 in the United States with a correlation coefficient (R) of 0.284 and weighted average of 85.6%. Similarly, the statistical analysis conducted on geographies consisting of 168,853,097 people shows a moderate positive correlation between the proportion of Celtics and labor force participation rate among population between the ages 30 and 34 in the United States with a correlation coefficient (R) of 0.403 and weighted average of 84.1%, a difference of 1.8%.
In Labor Force | Age 30-34 Correlation Summary
| Measurement | Immigrants from Australia | Celtic |
| Minimum | 53.9% | 59.4% |
| Maximum | 100.0% | 100.0% |
| Range | 46.1% | 40.6% |
| Mean | 88.3% | 85.9% |
| Median | 87.9% | 84.0% |
| Interquartile 25% (IQ1) | 84.0% | 79.3% |
| Interquartile 75% (IQ3) | 98.4% | 97.8% |
| Interquartile Range (IQR) | 14.4% | 18.6% |
| Standard Deviation (Sample) | 9.8% | 10.4% |
| Standard Deviation (Population) | 9.7% | 10.4% |
Similar Demographics by In Labor Force | Age 30-34
Demographics Similar to Immigrants from Australia by In Labor Force | Age 30-34
In terms of in labor force | age 30-34, the demographic groups most similar to Immigrants from Australia are Immigrants from Sweden (85.6%, a difference of 0.010%), Lithuanian (85.6%, a difference of 0.010%), Cape Verdean (85.6%, a difference of 0.020%), Immigrants from Morocco (85.6%, a difference of 0.030%), and Croatian (85.6%, a difference of 0.030%).
| Demographics | Rating | Rank | In Labor Force | Age 30-34 |
| Immigrants | Lithuania | 99.8 /100 | #43 | Exceptional 85.6% |
| Immigrants | Sri Lanka | 99.8 /100 | #44 | Exceptional 85.6% |
| Immigrants | Nepal | 99.8 /100 | #45 | Exceptional 85.6% |
| Immigrants | Morocco | 99.8 /100 | #46 | Exceptional 85.6% |
| Croatians | 99.8 /100 | #47 | Exceptional 85.6% |
| Immigrants | Sweden | 99.8 /100 | #48 | Exceptional 85.6% |
| Lithuanians | 99.8 /100 | #49 | Exceptional 85.6% |
| Immigrants | Australia | 99.8 /100 | #50 | Exceptional 85.6% |
| Cape Verdeans | 99.7 /100 | #51 | Exceptional 85.6% |
| Slovenes | 99.7 /100 | #52 | Exceptional 85.6% |
| Filipinos | 99.6 /100 | #53 | Exceptional 85.5% |
| Immigrants | Kenya | 99.6 /100 | #54 | Exceptional 85.5% |
| Immigrants | Turkey | 99.6 /100 | #55 | Exceptional 85.5% |
| Czechs | 99.6 /100 | #56 | Exceptional 85.5% |
| Russians | 99.6 /100 | #57 | Exceptional 85.5% |
Demographics Similar to Celtics by In Labor Force | Age 30-34
In terms of in labor force | age 30-34, the demographic groups most similar to Celtics are Immigrants from Barbados (84.0%, a difference of 0.0%), U.S. Virgin Islander (84.1%, a difference of 0.010%), English (84.0%, a difference of 0.010%), Venezuelan (84.0%, a difference of 0.010%), and French American Indian (84.1%, a difference of 0.030%).
| Demographics | Rating | Rank | In Labor Force | Age 30-34 |
| Immigrants | Bahamas | 2.6 /100 | #230 | Tragic 84.1% |
| Malaysians | 2.2 /100 | #231 | Tragic 84.1% |
| Immigrants | Immigrants | 2.0 /100 | #232 | Tragic 84.1% |
| West Indians | 1.9 /100 | #233 | Tragic 84.1% |
| Haitians | 1.8 /100 | #234 | Tragic 84.1% |
| French American Indians | 1.7 /100 | #235 | Tragic 84.1% |
| U.S. Virgin Islanders | 1.5 /100 | #236 | Tragic 84.1% |
| Celtics | 1.4 /100 | #237 | Tragic 84.1% |
| Immigrants | Barbados | 1.4 /100 | #238 | Tragic 84.0% |
| English | 1.4 /100 | #239 | Tragic 84.0% |
| Venezuelans | 1.3 /100 | #240 | Tragic 84.0% |
| Immigrants | Portugal | 1.2 /100 | #241 | Tragic 84.0% |
| Immigrants | Oceania | 1.1 /100 | #242 | Tragic 84.0% |
| Immigrants | Caribbean | 1.1 /100 | #243 | Tragic 84.0% |
| Basques | 0.9 /100 | #244 | Tragic 84.0% |