Immigrants from Australia vs Argentinean In Labor Force | Age 16-19
COMPARE
Immigrants from Australia
Argentinean
In Labor Force | Age 16-19
In Labor Force | Age 16-19 Comparison
Immigrants from Australia
Argentineans
35.1%
IN LABOR FORCE | AGE 16-19
3.6/ 100
METRIC RATING
236th/ 347
METRIC RANK
33.3%
IN LABOR FORCE | AGE 16-19
0.1/ 100
METRIC RATING
294th/ 347
METRIC RANK
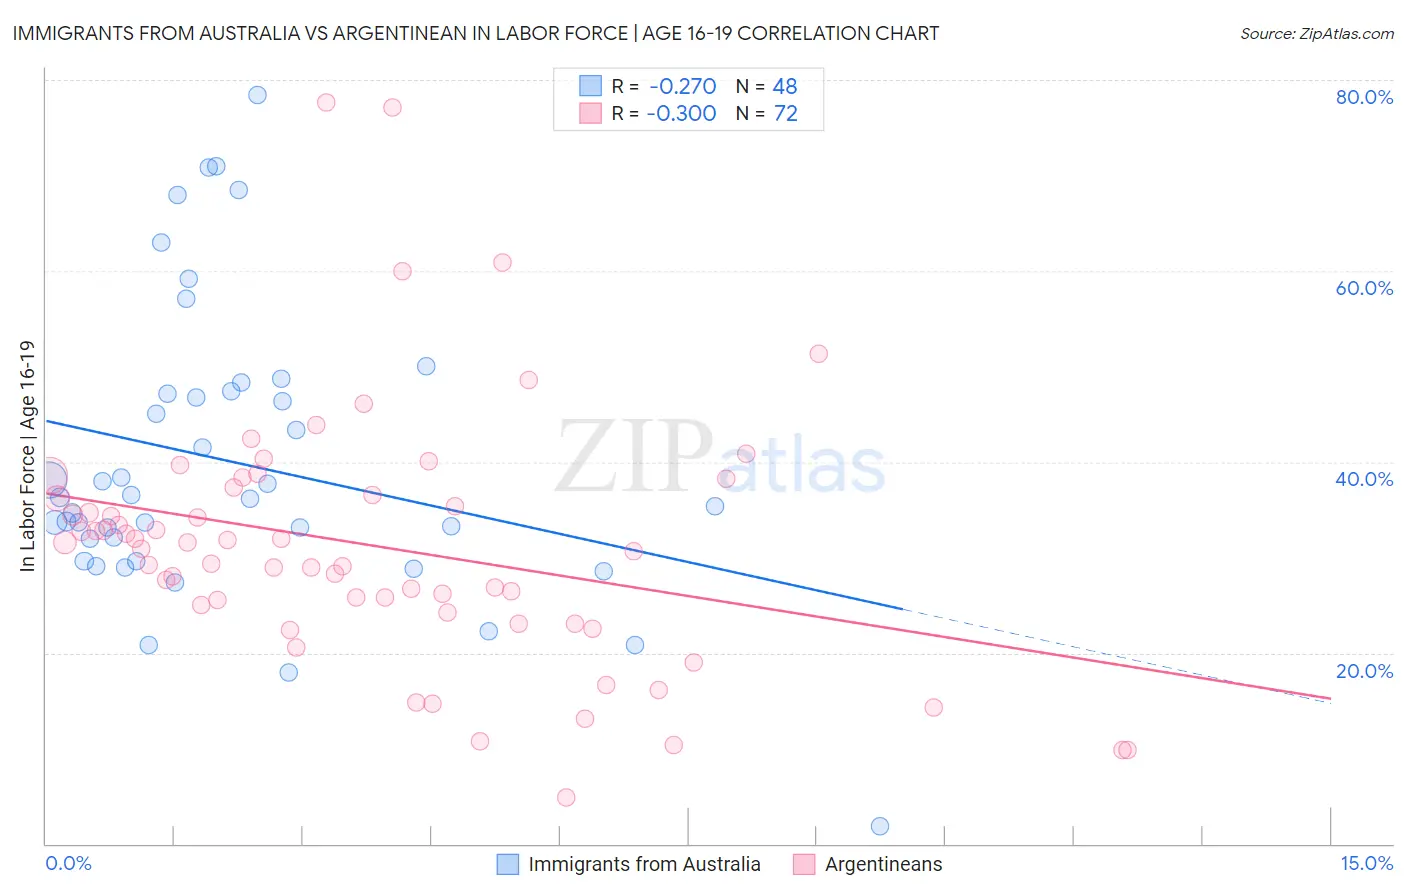
Immigrants from Australia vs Argentinean In Labor Force | Age 16-19 Correlation Chart
The statistical analysis conducted on geographies consisting of 226,866,182 people shows a weak negative correlation between the proportion of Immigrants from Australia and labor force participation rate among population between the ages 16 and 19 in the United States with a correlation coefficient (R) of -0.270 and weighted average of 35.1%. Similarly, the statistical analysis conducted on geographies consisting of 296,834,136 people shows a mild negative correlation between the proportion of Argentineans and labor force participation rate among population between the ages 16 and 19 in the United States with a correlation coefficient (R) of -0.300 and weighted average of 33.3%, a difference of 5.3%.
In Labor Force | Age 16-19 Correlation Summary
| Measurement | Immigrants from Australia | Argentinean |
| Minimum | 1.8% | 4.8% |
| Maximum | 78.4% | 77.6% |
| Range | 76.6% | 72.8% |
| Mean | 39.9% | 31.3% |
| Median | 36.2% | 31.2% |
| Interquartile 25% (IQ1) | 30.8% | 24.6% |
| Interquartile 75% (IQ3) | 47.3% | 36.9% |
| Interquartile Range (IQR) | 16.5% | 12.3% |
| Standard Deviation (Sample) | 15.3% | 13.4% |
| Standard Deviation (Population) | 15.2% | 13.3% |
Similar Demographics by In Labor Force | Age 16-19
Demographics Similar to Immigrants from Australia by In Labor Force | Age 16-19
In terms of in labor force | age 16-19, the demographic groups most similar to Immigrants from Australia are Immigrants from India (35.0%, a difference of 0.030%), Immigrants from Vietnam (35.0%, a difference of 0.070%), Immigrants from Philippines (35.1%, a difference of 0.14%), Inupiat (35.0%, a difference of 0.16%), and Immigrants from Mexico (35.1%, a difference of 0.22%).
| Demographics | Rating | Rank | In Labor Force | Age 16-19 |
| Immigrants | Lebanon | 5.0 /100 | #229 | Tragic 35.2% |
| Immigrants | Honduras | 4.9 /100 | #230 | Tragic 35.2% |
| Immigrants | Syria | 4.5 /100 | #231 | Tragic 35.2% |
| Immigrants | Kazakhstan | 4.5 /100 | #232 | Tragic 35.2% |
| Immigrants | France | 4.3 /100 | #233 | Tragic 35.1% |
| Immigrants | Mexico | 4.2 /100 | #234 | Tragic 35.1% |
| Immigrants | Philippines | 4.0 /100 | #235 | Tragic 35.1% |
| Immigrants | Australia | 3.6 /100 | #236 | Tragic 35.1% |
| Immigrants | India | 3.5 /100 | #237 | Tragic 35.0% |
| Immigrants | Vietnam | 3.4 /100 | #238 | Tragic 35.0% |
| Inupiat | 3.2 /100 | #239 | Tragic 35.0% |
| Immigrants | Central America | 3.0 /100 | #240 | Tragic 35.0% |
| Immigrants | Ireland | 2.9 /100 | #241 | Tragic 35.0% |
| Uruguayans | 2.6 /100 | #242 | Tragic 34.9% |
| Pueblo | 2.6 /100 | #243 | Tragic 34.9% |
Demographics Similar to Argentineans by In Labor Force | Age 16-19
In terms of in labor force | age 16-19, the demographic groups most similar to Argentineans are Immigrants from South America (33.3%, a difference of 0.020%), Yup'ik (33.3%, a difference of 0.10%), Jamaican (33.2%, a difference of 0.23%), Immigrants from Haiti (33.2%, a difference of 0.33%), and Haitian (33.4%, a difference of 0.34%).
| Demographics | Rating | Rank | In Labor Force | Age 16-19 |
| Nepalese | 0.1 /100 | #287 | Tragic 33.5% |
| Immigrants | Indonesia | 0.1 /100 | #288 | Tragic 33.5% |
| Immigrants | Singapore | 0.1 /100 | #289 | Tragic 33.5% |
| Immigrants | Colombia | 0.1 /100 | #290 | Tragic 33.5% |
| Immigrants | Belarus | 0.1 /100 | #291 | Tragic 33.4% |
| Haitians | 0.1 /100 | #292 | Tragic 33.4% |
| Immigrants | South America | 0.1 /100 | #293 | Tragic 33.3% |
| Argentineans | 0.1 /100 | #294 | Tragic 33.3% |
| Yup'ik | 0.1 /100 | #295 | Tragic 33.3% |
| Jamaicans | 0.1 /100 | #296 | Tragic 33.2% |
| Immigrants | Haiti | 0.1 /100 | #297 | Tragic 33.2% |
| Iranians | 0.0 /100 | #298 | Tragic 33.0% |
| Armenians | 0.0 /100 | #299 | Tragic 32.9% |
| Immigrants | Argentina | 0.0 /100 | #300 | Tragic 32.9% |
| Okinawans | 0.0 /100 | #301 | Tragic 32.8% |