Sierra Leonean vs Celtic In Labor Force | Age 30-34
COMPARE
Sierra Leonean
Celtic
In Labor Force | Age 30-34
In Labor Force | Age 30-34 Comparison
Sierra Leoneans
Celtics
86.0%
IN LABOR FORCE | AGE 30-34
100.0/ 100
METRIC RATING
19th/ 347
METRIC RANK
84.1%
IN LABOR FORCE | AGE 30-34
1.4/ 100
METRIC RATING
237th/ 347
METRIC RANK
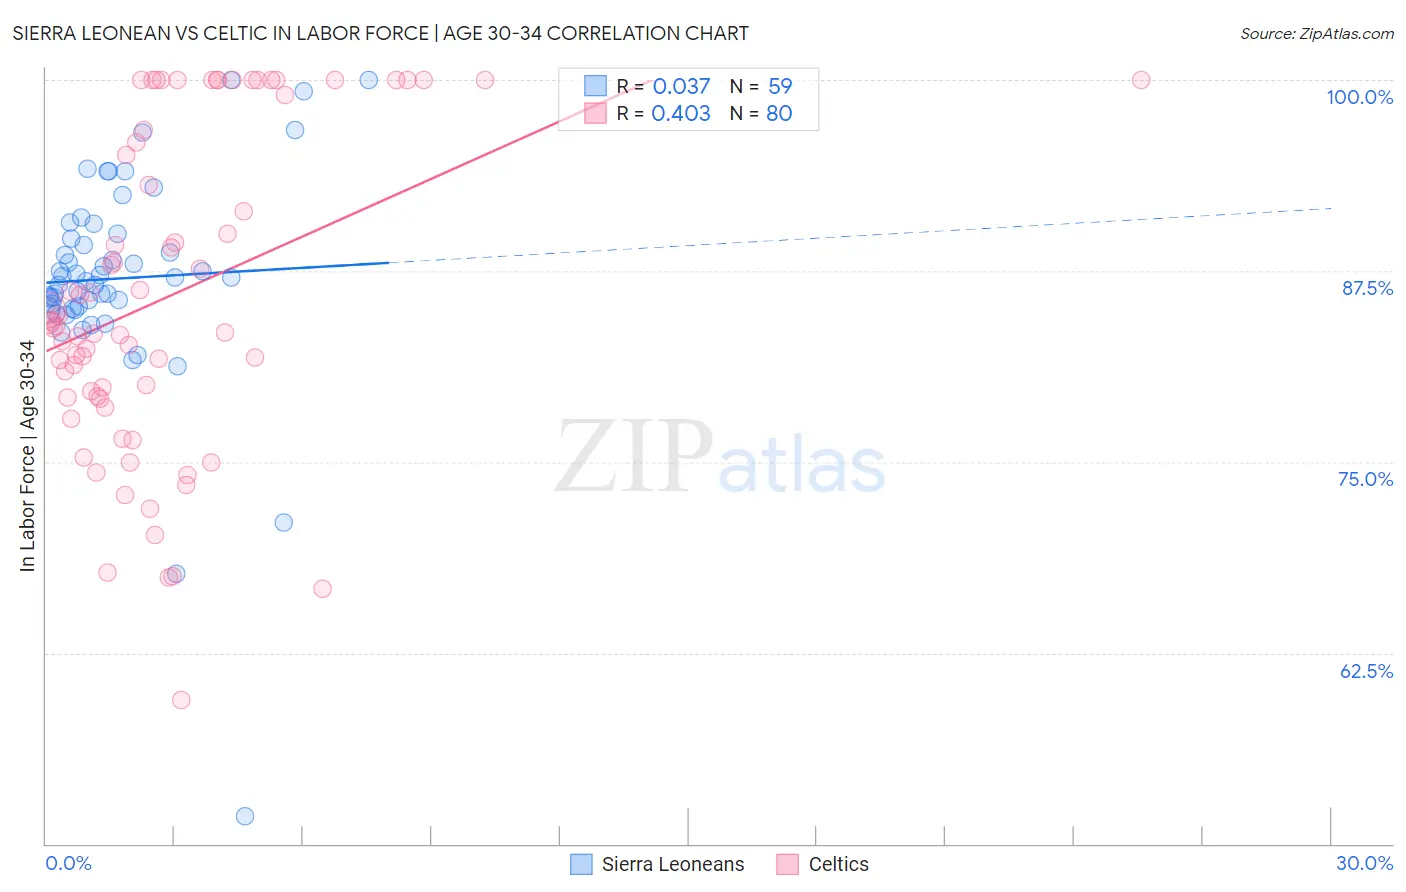
Sierra Leonean vs Celtic In Labor Force | Age 30-34 Correlation Chart
The statistical analysis conducted on geographies consisting of 83,346,965 people shows no correlation between the proportion of Sierra Leoneans and labor force participation rate among population between the ages 30 and 34 in the United States with a correlation coefficient (R) of 0.037 and weighted average of 86.0%. Similarly, the statistical analysis conducted on geographies consisting of 168,853,097 people shows a moderate positive correlation between the proportion of Celtics and labor force participation rate among population between the ages 30 and 34 in the United States with a correlation coefficient (R) of 0.403 and weighted average of 84.1%, a difference of 2.3%.
In Labor Force | Age 30-34 Correlation Summary
| Measurement | Sierra Leonean | Celtic |
| Minimum | 51.8% | 59.4% |
| Maximum | 100.0% | 100.0% |
| Range | 48.2% | 40.6% |
| Mean | 87.0% | 85.9% |
| Median | 87.1% | 84.0% |
| Interquartile 25% (IQ1) | 85.0% | 79.3% |
| Interquartile 75% (IQ3) | 89.9% | 97.8% |
| Interquartile Range (IQR) | 4.9% | 18.6% |
| Standard Deviation (Sample) | 7.3% | 10.4% |
| Standard Deviation (Population) | 7.2% | 10.4% |
Similar Demographics by In Labor Force | Age 30-34
Demographics Similar to Sierra Leoneans by In Labor Force | Age 30-34
In terms of in labor force | age 30-34, the demographic groups most similar to Sierra Leoneans are Bulgarian (86.0%, a difference of 0.010%), Immigrants from Bulgaria (86.0%, a difference of 0.010%), Bermudan (85.9%, a difference of 0.030%), Estonian (85.9%, a difference of 0.030%), and Immigrants from Eritrea (85.9%, a difference of 0.040%).
| Demographics | Rating | Rank | In Labor Force | Age 30-34 |
| Bolivians | 100.0 /100 | #12 | Exceptional 86.1% |
| Immigrants | Croatia | 100.0 /100 | #13 | Exceptional 86.1% |
| Immigrants | Cabo Verde | 100.0 /100 | #14 | Exceptional 86.1% |
| Immigrants | Albania | 100.0 /100 | #15 | Exceptional 86.1% |
| Latvians | 100.0 /100 | #16 | Exceptional 86.0% |
| Immigrants | Cameroon | 100.0 /100 | #17 | Exceptional 86.0% |
| Immigrants | Sierra Leone | 100.0 /100 | #18 | Exceptional 86.0% |
| Sierra Leoneans | 100.0 /100 | #19 | Exceptional 86.0% |
| Bulgarians | 100.0 /100 | #20 | Exceptional 86.0% |
| Immigrants | Bulgaria | 100.0 /100 | #21 | Exceptional 86.0% |
| Bermudans | 100.0 /100 | #22 | Exceptional 85.9% |
| Estonians | 100.0 /100 | #23 | Exceptional 85.9% |
| Immigrants | Eritrea | 100.0 /100 | #24 | Exceptional 85.9% |
| Immigrants | North Macedonia | 100.0 /100 | #25 | Exceptional 85.9% |
| Immigrants | Eastern Africa | 100.0 /100 | #26 | Exceptional 85.9% |
Demographics Similar to Celtics by In Labor Force | Age 30-34
In terms of in labor force | age 30-34, the demographic groups most similar to Celtics are Immigrants from Barbados (84.0%, a difference of 0.0%), U.S. Virgin Islander (84.1%, a difference of 0.010%), English (84.0%, a difference of 0.010%), Venezuelan (84.0%, a difference of 0.010%), and French American Indian (84.1%, a difference of 0.030%).
| Demographics | Rating | Rank | In Labor Force | Age 30-34 |
| Immigrants | Bahamas | 2.6 /100 | #230 | Tragic 84.1% |
| Malaysians | 2.2 /100 | #231 | Tragic 84.1% |
| Immigrants | Immigrants | 2.0 /100 | #232 | Tragic 84.1% |
| West Indians | 1.9 /100 | #233 | Tragic 84.1% |
| Haitians | 1.8 /100 | #234 | Tragic 84.1% |
| French American Indians | 1.7 /100 | #235 | Tragic 84.1% |
| U.S. Virgin Islanders | 1.5 /100 | #236 | Tragic 84.1% |
| Celtics | 1.4 /100 | #237 | Tragic 84.1% |
| Immigrants | Barbados | 1.4 /100 | #238 | Tragic 84.0% |
| English | 1.4 /100 | #239 | Tragic 84.0% |
| Venezuelans | 1.3 /100 | #240 | Tragic 84.0% |
| Immigrants | Portugal | 1.2 /100 | #241 | Tragic 84.0% |
| Immigrants | Oceania | 1.1 /100 | #242 | Tragic 84.0% |
| Immigrants | Caribbean | 1.1 /100 | #243 | Tragic 84.0% |
| Basques | 0.9 /100 | #244 | Tragic 84.0% |