Immigrants from Asia vs British West Indian In Labor Force | Age 20-24
COMPARE
Immigrants from Asia
British West Indian
In Labor Force | Age 20-24
In Labor Force | Age 20-24 Comparison
Immigrants from Asia
British West Indians
73.6%
IN LABOR FORCE | AGE 20-24
0.5/ 100
METRIC RATING
263rd/ 347
METRIC RANK
70.0%
IN LABOR FORCE | AGE 20-24
0.0/ 100
METRIC RATING
334th/ 347
METRIC RANK
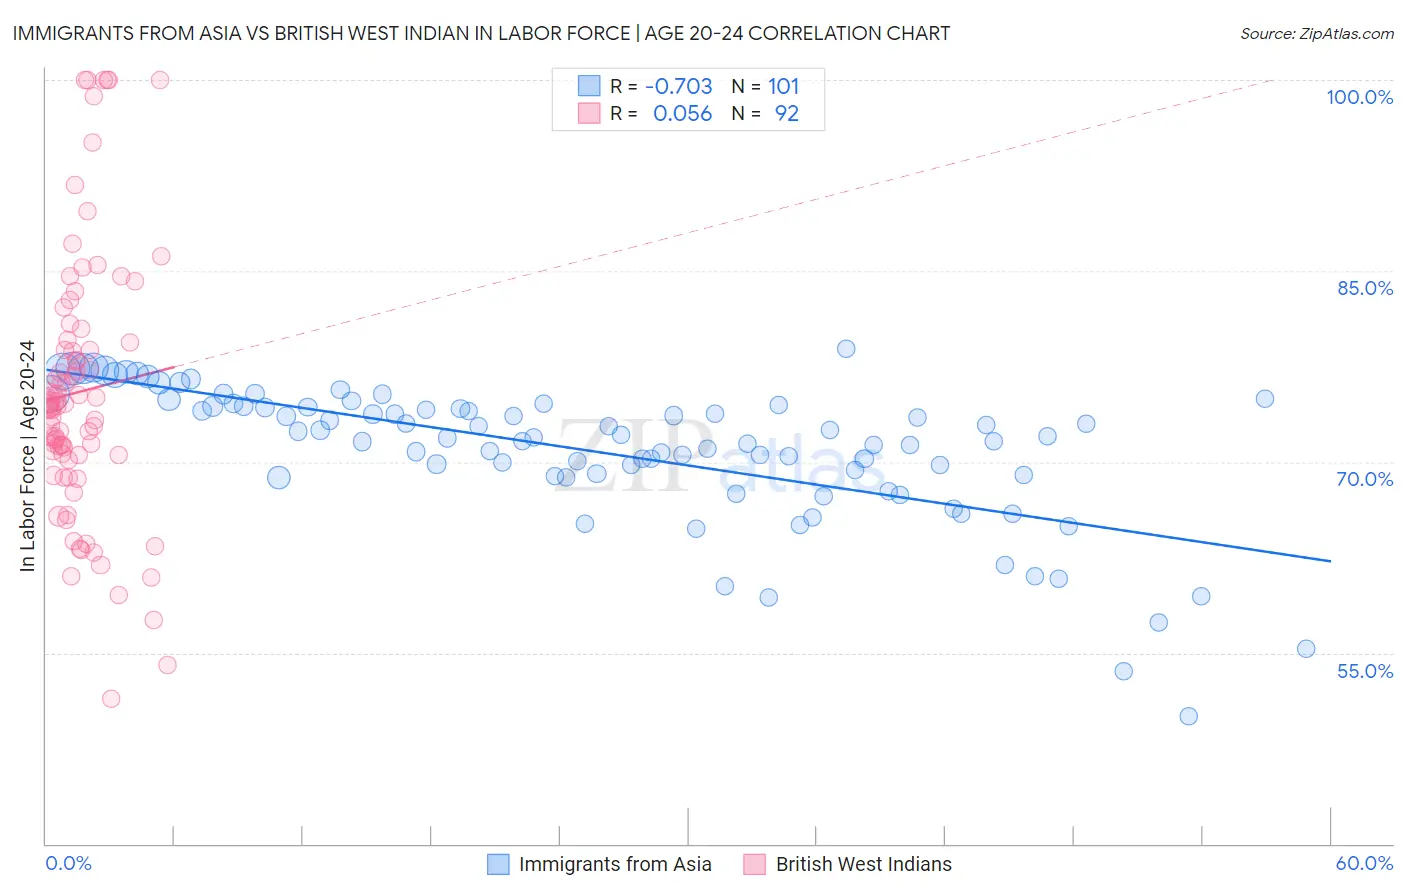
Immigrants from Asia vs British West Indian In Labor Force | Age 20-24 Correlation Chart
The statistical analysis conducted on geographies consisting of 548,419,832 people shows a strong negative correlation between the proportion of Immigrants from Asia and labor force participation rate among population between the ages 20 and 24 in the United States with a correlation coefficient (R) of -0.703 and weighted average of 73.6%. Similarly, the statistical analysis conducted on geographies consisting of 152,699,187 people shows a slight positive correlation between the proportion of British West Indians and labor force participation rate among population between the ages 20 and 24 in the United States with a correlation coefficient (R) of 0.056 and weighted average of 70.0%, a difference of 5.2%.
In Labor Force | Age 20-24 Correlation Summary
| Measurement | Immigrants from Asia | British West Indian |
| Minimum | 50.0% | 51.4% |
| Maximum | 78.9% | 100.0% |
| Range | 28.9% | 48.6% |
| Mean | 70.8% | 75.5% |
| Median | 72.0% | 74.5% |
| Interquartile 25% (IQ1) | 68.9% | 70.5% |
| Interquartile 75% (IQ3) | 74.4% | 79.5% |
| Interquartile Range (IQR) | 5.5% | 9.0% |
| Standard Deviation (Sample) | 5.5% | 10.5% |
| Standard Deviation (Population) | 5.5% | 10.4% |
Similar Demographics by In Labor Force | Age 20-24
Demographics Similar to Immigrants from Asia by In Labor Force | Age 20-24
In terms of in labor force | age 20-24, the demographic groups most similar to Immigrants from Asia are Immigrants from Haiti (73.6%, a difference of 0.010%), Burmese (73.6%, a difference of 0.020%), Haitian (73.6%, a difference of 0.030%), Immigrants from Western Asia (73.5%, a difference of 0.070%), and Asian (73.7%, a difference of 0.080%).
| Demographics | Rating | Rank | In Labor Force | Age 20-24 |
| Spanish American Indians | 0.8 /100 | #256 | Tragic 73.7% |
| Paraguayans | 0.8 /100 | #257 | Tragic 73.7% |
| Egyptians | 0.7 /100 | #258 | Tragic 73.7% |
| Dutch West Indians | 0.7 /100 | #259 | Tragic 73.7% |
| Immigrants | Turkey | 0.7 /100 | #260 | Tragic 73.7% |
| Houma | 0.6 /100 | #261 | Tragic 73.7% |
| Asians | 0.6 /100 | #262 | Tragic 73.7% |
| Immigrants | Asia | 0.5 /100 | #263 | Tragic 73.6% |
| Immigrants | Haiti | 0.5 /100 | #264 | Tragic 73.6% |
| Burmese | 0.5 /100 | #265 | Tragic 73.6% |
| Haitians | 0.5 /100 | #266 | Tragic 73.6% |
| Immigrants | Western Asia | 0.4 /100 | #267 | Tragic 73.5% |
| South Americans | 0.4 /100 | #268 | Tragic 73.5% |
| Colombians | 0.3 /100 | #269 | Tragic 73.5% |
| Immigrants | Russia | 0.3 /100 | #270 | Tragic 73.5% |
Demographics Similar to British West Indians by In Labor Force | Age 20-24
In terms of in labor force | age 20-24, the demographic groups most similar to British West Indians are Immigrants from Barbados (69.7%, a difference of 0.35%), Yuman (70.3%, a difference of 0.41%), Immigrants from Uzbekistan (70.4%, a difference of 0.63%), Immigrants from Bangladesh (70.6%, a difference of 0.94%), and Vietnamese (70.6%, a difference of 0.96%).
| Demographics | Rating | Rank | In Labor Force | Age 20-24 |
| Immigrants | Trinidad and Tobago | 0.0 /100 | #327 | Tragic 71.1% |
| Immigrants | China | 0.0 /100 | #328 | Tragic 71.1% |
| Yup'ik | 0.0 /100 | #329 | Tragic 70.9% |
| Vietnamese | 0.0 /100 | #330 | Tragic 70.6% |
| Immigrants | Bangladesh | 0.0 /100 | #331 | Tragic 70.6% |
| Immigrants | Uzbekistan | 0.0 /100 | #332 | Tragic 70.4% |
| Yuman | 0.0 /100 | #333 | Tragic 70.3% |
| British West Indians | 0.0 /100 | #334 | Tragic 70.0% |
| Immigrants | Barbados | 0.0 /100 | #335 | Tragic 69.7% |
| Immigrants | Guyana | 0.0 /100 | #336 | Tragic 69.3% |
| Guyanese | 0.0 /100 | #337 | Tragic 69.2% |
| Pima | 0.0 /100 | #338 | Tragic 69.0% |
| Immigrants | Yemen | 0.0 /100 | #339 | Tragic 68.9% |
| Menominee | 0.0 /100 | #340 | Tragic 68.7% |
| Tohono O'odham | 0.0 /100 | #341 | Tragic 68.6% |