Immigrants from Burma/Myanmar vs Tohono O'odham In Labor Force | Age 35-44
COMPARE
Immigrants from Burma/Myanmar
Tohono O'odham
In Labor Force | Age 35-44
In Labor Force | Age 35-44 Comparison
Immigrants from Burma/Myanmar
Tohono O'odham
84.0%
IN LABOR FORCE | AGE 35-44
6.1/ 100
METRIC RATING
225th/ 347
METRIC RANK
74.1%
IN LABOR FORCE | AGE 35-44
0.0/ 100
METRIC RATING
346th/ 347
METRIC RANK
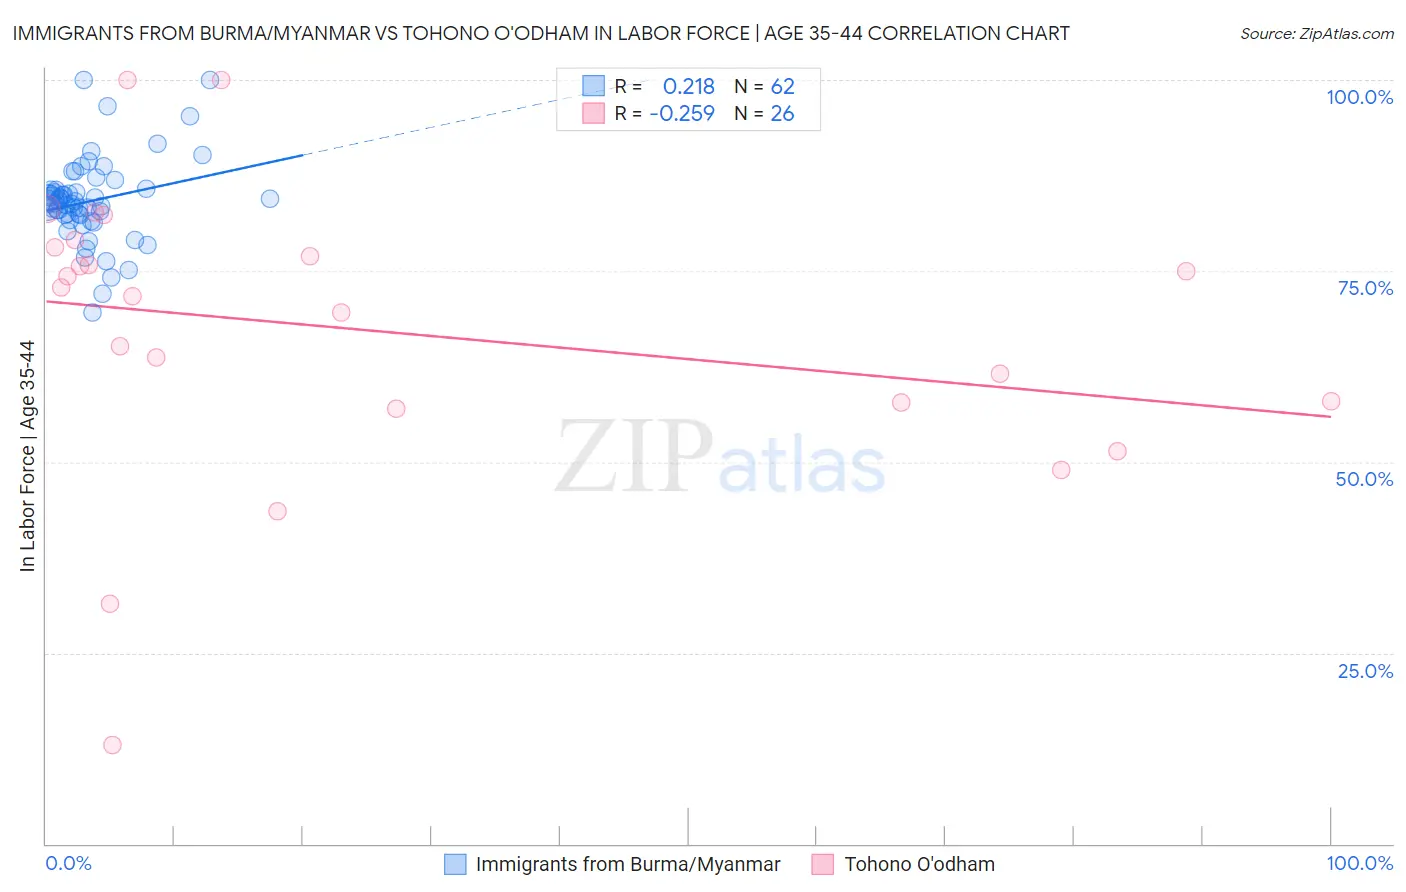
Immigrants from Burma/Myanmar vs Tohono O'odham In Labor Force | Age 35-44 Correlation Chart
The statistical analysis conducted on geographies consisting of 172,270,832 people shows a weak positive correlation between the proportion of Immigrants from Burma/Myanmar and labor force participation rate among population between the ages 35 and 44 in the United States with a correlation coefficient (R) of 0.218 and weighted average of 84.0%. Similarly, the statistical analysis conducted on geographies consisting of 58,719,465 people shows a weak negative correlation between the proportion of Tohono O'odham and labor force participation rate among population between the ages 35 and 44 in the United States with a correlation coefficient (R) of -0.259 and weighted average of 74.1%, a difference of 13.3%.
In Labor Force | Age 35-44 Correlation Summary
| Measurement | Immigrants from Burma/Myanmar | Tohono O'odham |
| Minimum | 69.6% | 13.0% |
| Maximum | 100.0% | 100.0% |
| Range | 30.4% | 87.0% |
| Mean | 84.2% | 67.2% |
| Median | 84.1% | 72.2% |
| Interquartile 25% (IQ1) | 82.3% | 57.8% |
| Interquartile 75% (IQ3) | 85.6% | 78.1% |
| Interquartile Range (IQR) | 3.3% | 20.3% |
| Standard Deviation (Sample) | 5.6% | 19.2% |
| Standard Deviation (Population) | 5.5% | 18.8% |
Similar Demographics by In Labor Force | Age 35-44
Demographics Similar to Immigrants from Burma/Myanmar by In Labor Force | Age 35-44
In terms of in labor force | age 35-44, the demographic groups most similar to Immigrants from Burma/Myanmar are U.S. Virgin Islander (84.0%, a difference of 0.0%), Assyrian/Chaldean/Syriac (84.0%, a difference of 0.010%), Immigrants from Panama (84.0%, a difference of 0.010%), Icelander (84.0%, a difference of 0.020%), and Panamanian (84.0%, a difference of 0.020%).
| Demographics | Rating | Rank | In Labor Force | Age 35-44 |
| Immigrants | Nicaragua | 9.4 /100 | #218 | Tragic 84.1% |
| Sub-Saharan Africans | 9.3 /100 | #219 | Tragic 84.1% |
| French | 7.5 /100 | #220 | Tragic 84.0% |
| Icelanders | 6.7 /100 | #221 | Tragic 84.0% |
| Assyrians/Chaldeans/Syriacs | 6.6 /100 | #222 | Tragic 84.0% |
| Immigrants | Panama | 6.4 /100 | #223 | Tragic 84.0% |
| U.S. Virgin Islanders | 6.1 /100 | #224 | Tragic 84.0% |
| Immigrants | Burma/Myanmar | 6.1 /100 | #225 | Tragic 84.0% |
| Panamanians | 5.4 /100 | #226 | Tragic 84.0% |
| British West Indians | 5.3 /100 | #227 | Tragic 84.0% |
| Welsh | 5.3 /100 | #228 | Tragic 84.0% |
| Immigrants | Thailand | 4.7 /100 | #229 | Tragic 84.0% |
| Immigrants | Iraq | 3.7 /100 | #230 | Tragic 83.9% |
| Scottish | 3.2 /100 | #231 | Tragic 83.9% |
| Native Hawaiians | 3.0 /100 | #232 | Tragic 83.9% |
Demographics Similar to Tohono O'odham by In Labor Force | Age 35-44
In terms of in labor force | age 35-44, the demographic groups most similar to Tohono O'odham are Navajo (73.8%, a difference of 0.38%), Yuman (74.7%, a difference of 0.83%), Pima (74.8%, a difference of 0.96%), Immigrants from Yemen (76.3%, a difference of 2.9%), and Crow (76.5%, a difference of 3.2%).
| Demographics | Rating | Rank | In Labor Force | Age 35-44 |
| Kiowa | 0.0 /100 | #333 | Tragic 79.2% |
| Yakama | 0.0 /100 | #334 | Tragic 79.0% |
| Natives/Alaskans | 0.0 /100 | #335 | Tragic 78.9% |
| Arapaho | 0.0 /100 | #336 | Tragic 78.1% |
| Apache | 0.0 /100 | #337 | Tragic 77.9% |
| Pueblo | 0.0 /100 | #338 | Tragic 77.4% |
| Yup'ik | 0.0 /100 | #339 | Tragic 77.3% |
| Lumbee | 0.0 /100 | #340 | Tragic 77.0% |
| Hopi | 0.0 /100 | #341 | Tragic 77.0% |
| Crow | 0.0 /100 | #342 | Tragic 76.5% |
| Immigrants | Yemen | 0.0 /100 | #343 | Tragic 76.3% |
| Pima | 0.0 /100 | #344 | Tragic 74.8% |
| Yuman | 0.0 /100 | #345 | Tragic 74.7% |
| Tohono O'odham | 0.0 /100 | #346 | Tragic 74.1% |
| Navajo | 0.0 /100 | #347 | Tragic 73.8% |