Immigrants from Fiji vs Immigrants from Denmark In Labor Force | Age 20-64
COMPARE
Immigrants from Fiji
Immigrants from Denmark
In Labor Force | Age 20-64
In Labor Force | Age 20-64 Comparison
Immigrants from Fiji
Immigrants from Denmark
78.6%
IN LABOR FORCE | AGE 20-64
0.3/ 100
METRIC RATING
260th/ 347
METRIC RANK
79.4%
IN LABOR FORCE | AGE 20-64
26.9/ 100
METRIC RATING
192nd/ 347
METRIC RANK
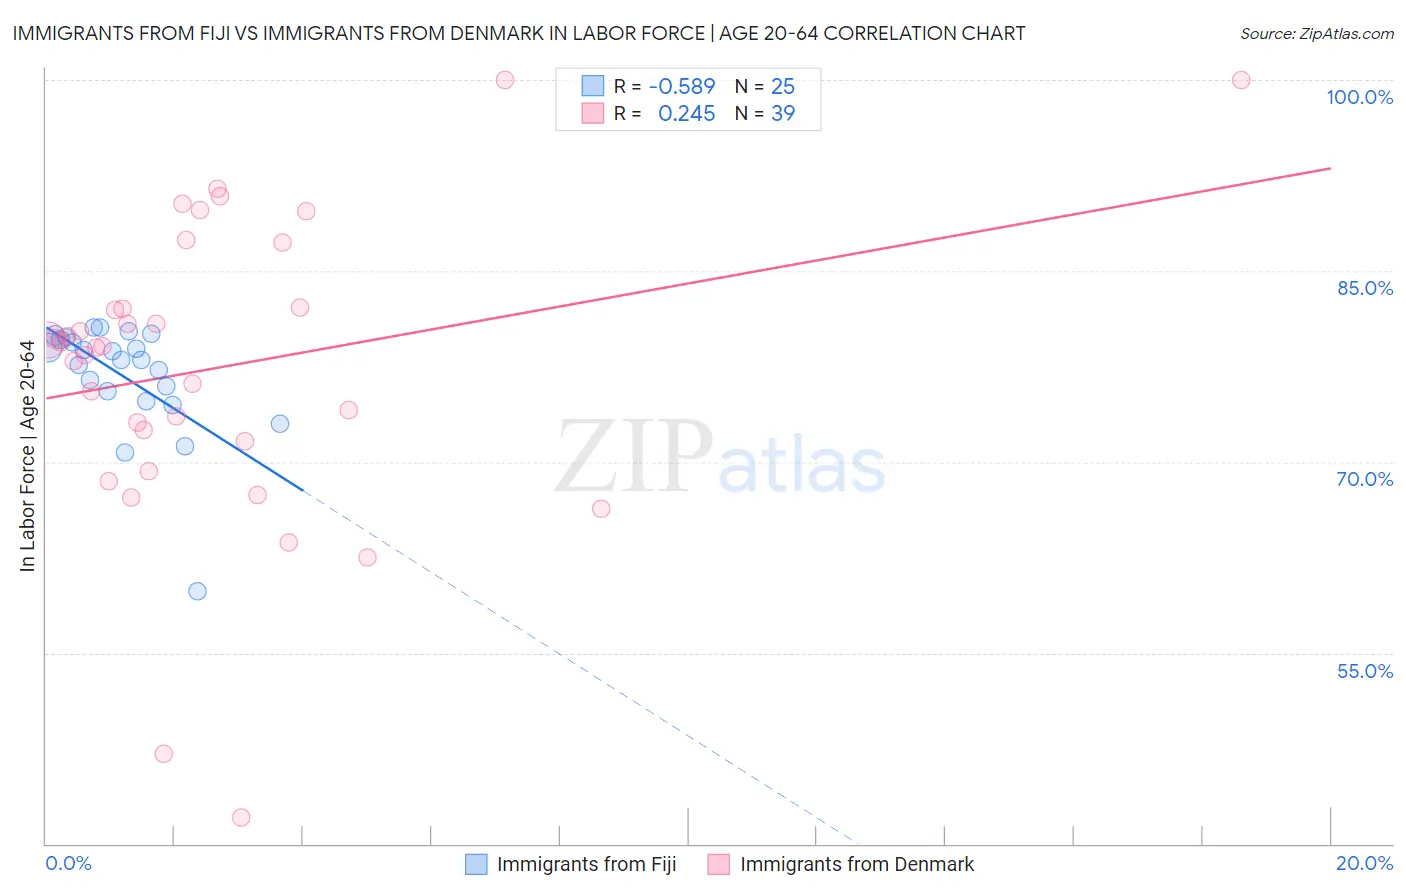
Immigrants from Fiji vs Immigrants from Denmark In Labor Force | Age 20-64 Correlation Chart
The statistical analysis conducted on geographies consisting of 93,756,016 people shows a substantial negative correlation between the proportion of Immigrants from Fiji and labor force participation rate among population between the ages 20 and 64 in the United States with a correlation coefficient (R) of -0.589 and weighted average of 78.6%. Similarly, the statistical analysis conducted on geographies consisting of 136,432,253 people shows a weak positive correlation between the proportion of Immigrants from Denmark and labor force participation rate among population between the ages 20 and 64 in the United States with a correlation coefficient (R) of 0.245 and weighted average of 79.4%, a difference of 1.0%.
In Labor Force | Age 20-64 Correlation Summary
| Measurement | Immigrants from Fiji | Immigrants from Denmark |
| Minimum | 59.8% | 42.1% |
| Maximum | 80.6% | 100.0% |
| Range | 20.8% | 57.9% |
| Mean | 76.7% | 77.4% |
| Median | 78.0% | 79.1% |
| Interquartile 25% (IQ1) | 75.2% | 71.6% |
| Interquartile 75% (IQ3) | 79.7% | 82.1% |
| Interquartile Range (IQR) | 4.5% | 10.5% |
| Standard Deviation (Sample) | 4.5% | 11.9% |
| Standard Deviation (Population) | 4.4% | 11.7% |
Similar Demographics by In Labor Force | Age 20-64
Demographics Similar to Immigrants from Fiji by In Labor Force | Age 20-64
In terms of in labor force | age 20-64, the demographic groups most similar to Immigrants from Fiji are Tsimshian (78.7%, a difference of 0.070%), Guatemalan (78.7%, a difference of 0.11%), Immigrants from Guatemala (78.7%, a difference of 0.11%), White/Caucasian (78.5%, a difference of 0.11%), and Hawaiian (78.7%, a difference of 0.13%).
| Demographics | Rating | Rank | In Labor Force | Age 20-64 |
| Basques | 0.5 /100 | #253 | Tragic 78.7% |
| Immigrants | Lebanon | 0.5 /100 | #254 | Tragic 78.7% |
| Hawaiians | 0.5 /100 | #255 | Tragic 78.7% |
| Celtics | 0.5 /100 | #256 | Tragic 78.7% |
| Guatemalans | 0.4 /100 | #257 | Tragic 78.7% |
| Immigrants | Guatemala | 0.4 /100 | #258 | Tragic 78.7% |
| Tsimshian | 0.4 /100 | #259 | Tragic 78.7% |
| Immigrants | Fiji | 0.3 /100 | #260 | Tragic 78.6% |
| Whites/Caucasians | 0.2 /100 | #261 | Tragic 78.5% |
| Fijians | 0.1 /100 | #262 | Tragic 78.4% |
| Pennsylvania Germans | 0.1 /100 | #263 | Tragic 78.4% |
| Spaniards | 0.1 /100 | #264 | Tragic 78.4% |
| British West Indians | 0.1 /100 | #265 | Tragic 78.4% |
| Bahamians | 0.1 /100 | #266 | Tragic 78.4% |
| U.S. Virgin Islanders | 0.1 /100 | #267 | Tragic 78.4% |
Demographics Similar to Immigrants from Denmark by In Labor Force | Age 20-64
In terms of in labor force | age 20-64, the demographic groups most similar to Immigrants from Denmark are Indonesian (79.4%, a difference of 0.010%), Swiss (79.4%, a difference of 0.020%), Immigrants from Thailand (79.4%, a difference of 0.020%), Immigrants from Austria (79.4%, a difference of 0.030%), and Immigrants from El Salvador (79.4%, a difference of 0.040%).
| Demographics | Rating | Rank | In Labor Force | Age 20-64 |
| Israelis | 34.7 /100 | #185 | Fair 79.5% |
| Northern Europeans | 34.5 /100 | #186 | Fair 79.5% |
| Assyrians/Chaldeans/Syriacs | 33.3 /100 | #187 | Fair 79.4% |
| Immigrants | Haiti | 32.1 /100 | #188 | Fair 79.4% |
| Immigrants | El Salvador | 30.9 /100 | #189 | Fair 79.4% |
| Immigrants | Syria | 30.8 /100 | #190 | Fair 79.4% |
| Swiss | 28.9 /100 | #191 | Fair 79.4% |
| Immigrants | Denmark | 26.9 /100 | #192 | Fair 79.4% |
| Indonesians | 26.1 /100 | #193 | Fair 79.4% |
| Immigrants | Thailand | 24.8 /100 | #194 | Fair 79.4% |
| Immigrants | Austria | 23.7 /100 | #195 | Fair 79.4% |
| Ecuadorians | 23.1 /100 | #196 | Fair 79.4% |
| Immigrants | Senegal | 22.5 /100 | #197 | Fair 79.4% |
| Immigrants | Laos | 21.5 /100 | #198 | Fair 79.4% |
| Dutch | 20.2 /100 | #199 | Fair 79.3% |