Immigrants from Albania vs Immigrants from Korea In Labor Force | Age 20-24
COMPARE
Immigrants from Albania
Immigrants from Korea
In Labor Force | Age 20-24
In Labor Force | Age 20-24 Comparison
Immigrants from Albania
Immigrants from Korea
74.2%
IN LABOR FORCE | AGE 20-24
4.3/ 100
METRIC RATING
230th/ 347
METRIC RANK
73.1%
IN LABOR FORCE | AGE 20-24
0.1/ 100
METRIC RATING
287th/ 347
METRIC RANK
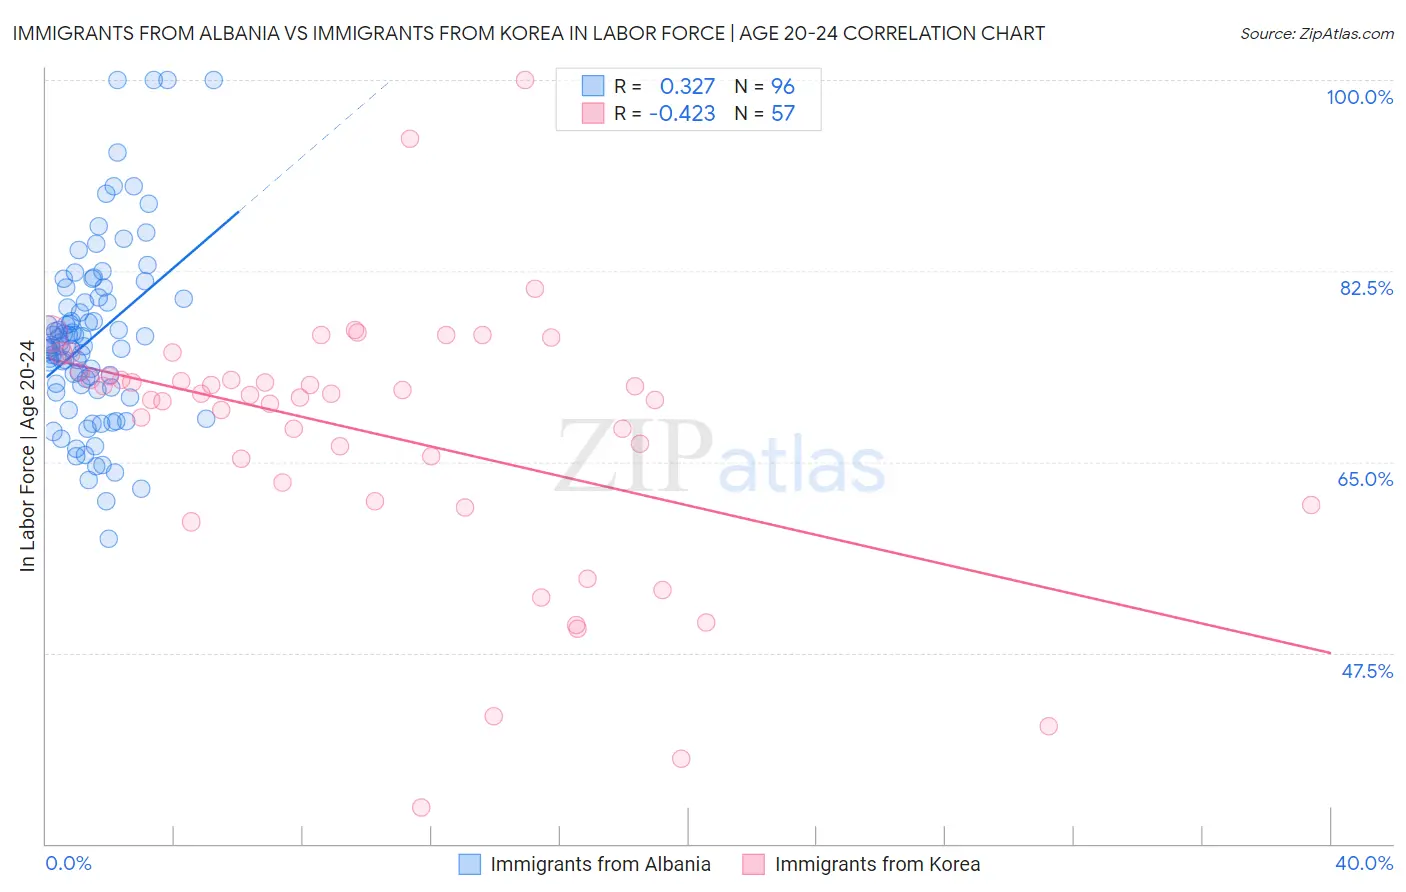
Immigrants from Albania vs Immigrants from Korea In Labor Force | Age 20-24 Correlation Chart
The statistical analysis conducted on geographies consisting of 119,383,108 people shows a mild positive correlation between the proportion of Immigrants from Albania and labor force participation rate among population between the ages 20 and 24 in the United States with a correlation coefficient (R) of 0.327 and weighted average of 74.2%. Similarly, the statistical analysis conducted on geographies consisting of 416,204,507 people shows a moderate negative correlation between the proportion of Immigrants from Korea and labor force participation rate among population between the ages 20 and 24 in the United States with a correlation coefficient (R) of -0.423 and weighted average of 73.1%, a difference of 1.5%.
In Labor Force | Age 20-24 Correlation Summary
| Measurement | Immigrants from Albania | Immigrants from Korea |
| Minimum | 58.0% | 33.3% |
| Maximum | 100.0% | 100.0% |
| Range | 42.0% | 66.7% |
| Mean | 76.4% | 67.6% |
| Median | 75.7% | 71.1% |
| Interquartile 25% (IQ1) | 71.7% | 62.2% |
| Interquartile 75% (IQ3) | 80.0% | 73.1% |
| Interquartile Range (IQR) | 8.3% | 10.8% |
| Standard Deviation (Sample) | 8.4% | 12.2% |
| Standard Deviation (Population) | 8.3% | 12.1% |
Similar Demographics by In Labor Force | Age 20-24
Demographics Similar to Immigrants from Albania by In Labor Force | Age 20-24
In terms of in labor force | age 20-24, the demographic groups most similar to Immigrants from Albania are Immigrants from Greece (74.2%, a difference of 0.020%), Immigrants from Switzerland (74.2%, a difference of 0.020%), Immigrants from Sweden (74.2%, a difference of 0.030%), Immigrants from Ukraine (74.2%, a difference of 0.060%), and Immigrants from Chile (74.1%, a difference of 0.060%).
| Demographics | Rating | Rank | In Labor Force | Age 20-24 |
| Hispanics or Latinos | 7.9 /100 | #223 | Tragic 74.4% |
| Seminole | 6.9 /100 | #224 | Tragic 74.3% |
| Ghanaians | 6.2 /100 | #225 | Tragic 74.3% |
| Immigrants | Fiji | 5.9 /100 | #226 | Tragic 74.3% |
| Immigrants | Ireland | 5.8 /100 | #227 | Tragic 74.3% |
| Immigrants | Ukraine | 5.1 /100 | #228 | Tragic 74.2% |
| Immigrants | Sweden | 4.6 /100 | #229 | Tragic 74.2% |
| Immigrants | Albania | 4.3 /100 | #230 | Tragic 74.2% |
| Immigrants | Greece | 4.1 /100 | #231 | Tragic 74.2% |
| Immigrants | Switzerland | 4.1 /100 | #232 | Tragic 74.2% |
| Immigrants | Chile | 3.7 /100 | #233 | Tragic 74.1% |
| Immigrants | Immigrants | 3.6 /100 | #234 | Tragic 74.1% |
| Laotians | 3.5 /100 | #235 | Tragic 74.1% |
| Immigrants | France | 3.3 /100 | #236 | Tragic 74.1% |
| Bermudans | 3.2 /100 | #237 | Tragic 74.1% |
Demographics Similar to Immigrants from Korea by In Labor Force | Age 20-24
In terms of in labor force | age 20-24, the demographic groups most similar to Immigrants from Korea are Immigrants from Lebanon (73.1%, a difference of 0.020%), Nicaraguan (73.2%, a difference of 0.050%), Argentinean (73.1%, a difference of 0.080%), Kiowa (73.2%, a difference of 0.11%), and U.S. Virgin Islander (73.0%, a difference of 0.11%).
| Demographics | Rating | Rank | In Labor Force | Age 20-24 |
| Bahamians | 0.1 /100 | #280 | Tragic 73.3% |
| Immigrants | Venezuela | 0.1 /100 | #281 | Tragic 73.2% |
| Immigrants | Spain | 0.1 /100 | #282 | Tragic 73.2% |
| Immigrants | Bahamas | 0.1 /100 | #283 | Tragic 73.2% |
| Kiowa | 0.1 /100 | #284 | Tragic 73.2% |
| Nicaraguans | 0.1 /100 | #285 | Tragic 73.2% |
| Immigrants | Lebanon | 0.1 /100 | #286 | Tragic 73.1% |
| Immigrants | Korea | 0.1 /100 | #287 | Tragic 73.1% |
| Argentineans | 0.1 /100 | #288 | Tragic 73.1% |
| U.S. Virgin Islanders | 0.1 /100 | #289 | Tragic 73.0% |
| Immigrants | Belarus | 0.1 /100 | #290 | Tragic 73.0% |
| Immigrants | Nicaragua | 0.0 /100 | #291 | Tragic 72.9% |
| Pueblo | 0.0 /100 | #292 | Tragic 72.9% |
| Immigrants | Belize | 0.0 /100 | #293 | Tragic 72.8% |
| Immigrants | Argentina | 0.0 /100 | #294 | Tragic 72.8% |