Immigrants from Albania vs Immigrants from Zimbabwe In Labor Force | Age 20-24
COMPARE
Immigrants from Albania
Immigrants from Zimbabwe
In Labor Force | Age 20-24
In Labor Force | Age 20-24 Comparison
Immigrants from Albania
Immigrants from Zimbabwe
74.2%
IN LABOR FORCE | AGE 20-24
4.3/ 100
METRIC RATING
230th/ 347
METRIC RANK
75.9%
IN LABOR FORCE | AGE 20-24
95.1/ 100
METRIC RATING
114th/ 347
METRIC RANK
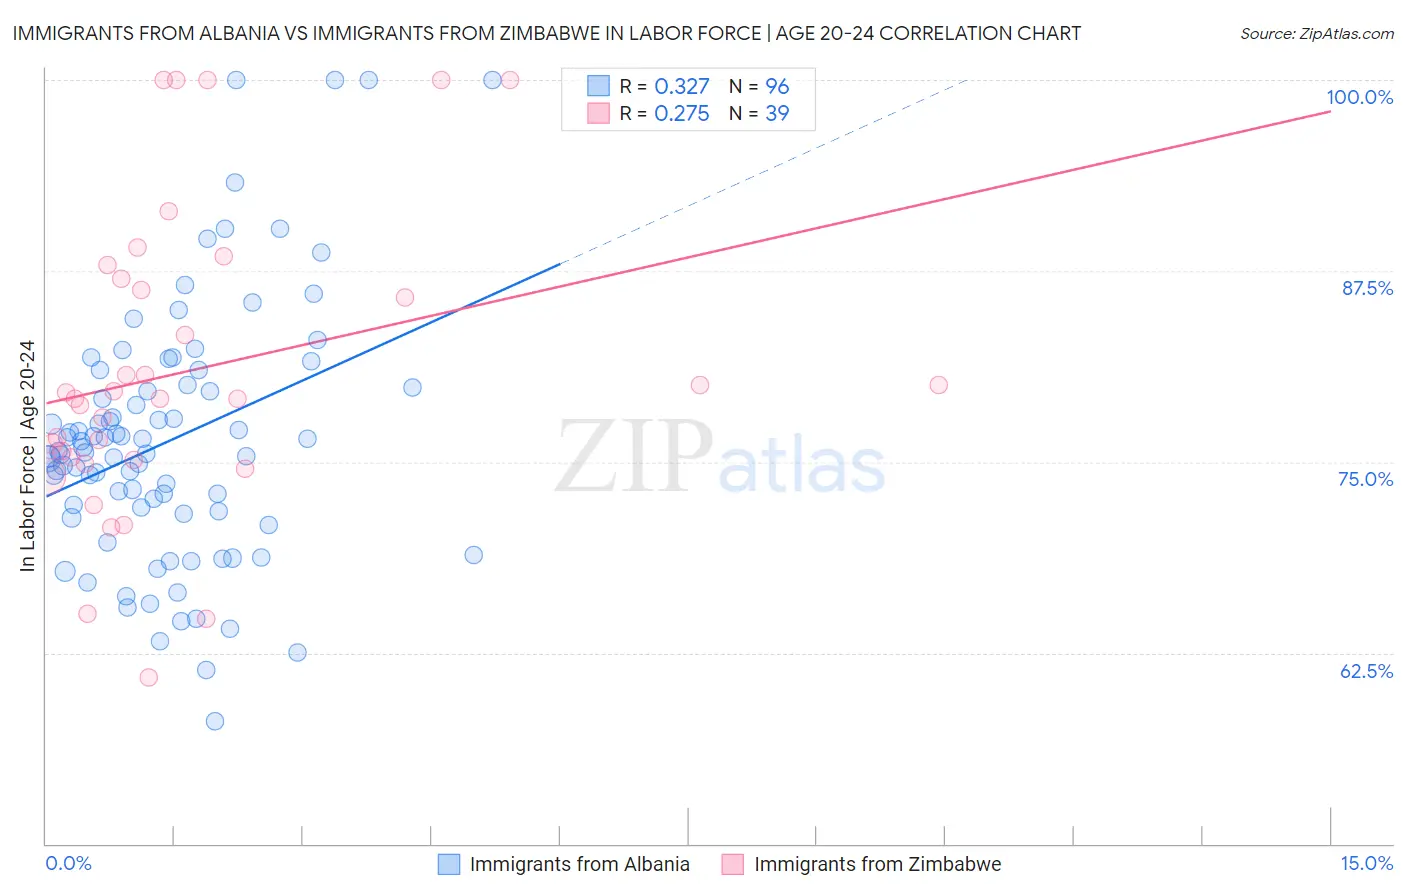
Immigrants from Albania vs Immigrants from Zimbabwe In Labor Force | Age 20-24 Correlation Chart
The statistical analysis conducted on geographies consisting of 119,383,108 people shows a mild positive correlation between the proportion of Immigrants from Albania and labor force participation rate among population between the ages 20 and 24 in the United States with a correlation coefficient (R) of 0.327 and weighted average of 74.2%. Similarly, the statistical analysis conducted on geographies consisting of 117,807,327 people shows a weak positive correlation between the proportion of Immigrants from Zimbabwe and labor force participation rate among population between the ages 20 and 24 in the United States with a correlation coefficient (R) of 0.275 and weighted average of 75.9%, a difference of 2.2%.
In Labor Force | Age 20-24 Correlation Summary
| Measurement | Immigrants from Albania | Immigrants from Zimbabwe |
| Minimum | 58.0% | 60.9% |
| Maximum | 100.0% | 100.0% |
| Range | 42.0% | 39.1% |
| Mean | 76.4% | 81.0% |
| Median | 75.7% | 79.2% |
| Interquartile 25% (IQ1) | 71.7% | 75.2% |
| Interquartile 75% (IQ3) | 80.0% | 87.0% |
| Interquartile Range (IQR) | 8.3% | 11.9% |
| Standard Deviation (Sample) | 8.4% | 9.9% |
| Standard Deviation (Population) | 8.3% | 9.7% |
Similar Demographics by In Labor Force | Age 20-24
Demographics Similar to Immigrants from Albania by In Labor Force | Age 20-24
In terms of in labor force | age 20-24, the demographic groups most similar to Immigrants from Albania are Immigrants from Greece (74.2%, a difference of 0.020%), Immigrants from Switzerland (74.2%, a difference of 0.020%), Immigrants from Sweden (74.2%, a difference of 0.030%), Immigrants from Ukraine (74.2%, a difference of 0.060%), and Immigrants from Chile (74.1%, a difference of 0.060%).
| Demographics | Rating | Rank | In Labor Force | Age 20-24 |
| Hispanics or Latinos | 7.9 /100 | #223 | Tragic 74.4% |
| Seminole | 6.9 /100 | #224 | Tragic 74.3% |
| Ghanaians | 6.2 /100 | #225 | Tragic 74.3% |
| Immigrants | Fiji | 5.9 /100 | #226 | Tragic 74.3% |
| Immigrants | Ireland | 5.8 /100 | #227 | Tragic 74.3% |
| Immigrants | Ukraine | 5.1 /100 | #228 | Tragic 74.2% |
| Immigrants | Sweden | 4.6 /100 | #229 | Tragic 74.2% |
| Immigrants | Albania | 4.3 /100 | #230 | Tragic 74.2% |
| Immigrants | Greece | 4.1 /100 | #231 | Tragic 74.2% |
| Immigrants | Switzerland | 4.1 /100 | #232 | Tragic 74.2% |
| Immigrants | Chile | 3.7 /100 | #233 | Tragic 74.1% |
| Immigrants | Immigrants | 3.6 /100 | #234 | Tragic 74.1% |
| Laotians | 3.5 /100 | #235 | Tragic 74.1% |
| Immigrants | France | 3.3 /100 | #236 | Tragic 74.1% |
| Bermudans | 3.2 /100 | #237 | Tragic 74.1% |
Demographics Similar to Immigrants from Zimbabwe by In Labor Force | Age 20-24
In terms of in labor force | age 20-24, the demographic groups most similar to Immigrants from Zimbabwe are Alaska Native (75.9%, a difference of 0.0%), Immigrants from Netherlands (75.9%, a difference of 0.010%), Immigrants from North America (75.9%, a difference of 0.010%), Assyrian/Chaldean/Syriac (75.9%, a difference of 0.020%), and Spanish American (75.8%, a difference of 0.020%).
| Demographics | Rating | Rank | In Labor Force | Age 20-24 |
| Greeks | 96.9 /100 | #107 | Exceptional 76.0% |
| Iraqis | 96.6 /100 | #108 | Exceptional 76.0% |
| Cherokee | 95.8 /100 | #109 | Exceptional 75.9% |
| Immigrants | Morocco | 95.8 /100 | #110 | Exceptional 75.9% |
| Ukrainians | 95.7 /100 | #111 | Exceptional 75.9% |
| Immigrants | Canada | 95.6 /100 | #112 | Exceptional 75.9% |
| Immigrants | Netherlands | 95.3 /100 | #113 | Exceptional 75.9% |
| Immigrants | Zimbabwe | 95.1 /100 | #114 | Exceptional 75.9% |
| Alaska Natives | 95.1 /100 | #115 | Exceptional 75.9% |
| Immigrants | North America | 95.0 /100 | #116 | Exceptional 75.9% |
| Assyrians/Chaldeans/Syriacs | 94.9 /100 | #117 | Exceptional 75.9% |
| Spanish Americans | 94.8 /100 | #118 | Exceptional 75.8% |
| Immigrants | Portugal | 94.8 /100 | #119 | Exceptional 75.8% |
| Immigrants | Africa | 94.6 /100 | #120 | Exceptional 75.8% |
| Immigrants | Serbia | 94.3 /100 | #121 | Exceptional 75.8% |