Immigrants from Serbia vs Immigrants from Korea In Labor Force | Age 20-24
COMPARE
Immigrants from Serbia
Immigrants from Korea
In Labor Force | Age 20-24
In Labor Force | Age 20-24 Comparison
Immigrants from Serbia
Immigrants from Korea
75.8%
IN LABOR FORCE | AGE 20-24
94.3/ 100
METRIC RATING
121st/ 347
METRIC RANK
73.1%
IN LABOR FORCE | AGE 20-24
0.1/ 100
METRIC RATING
287th/ 347
METRIC RANK
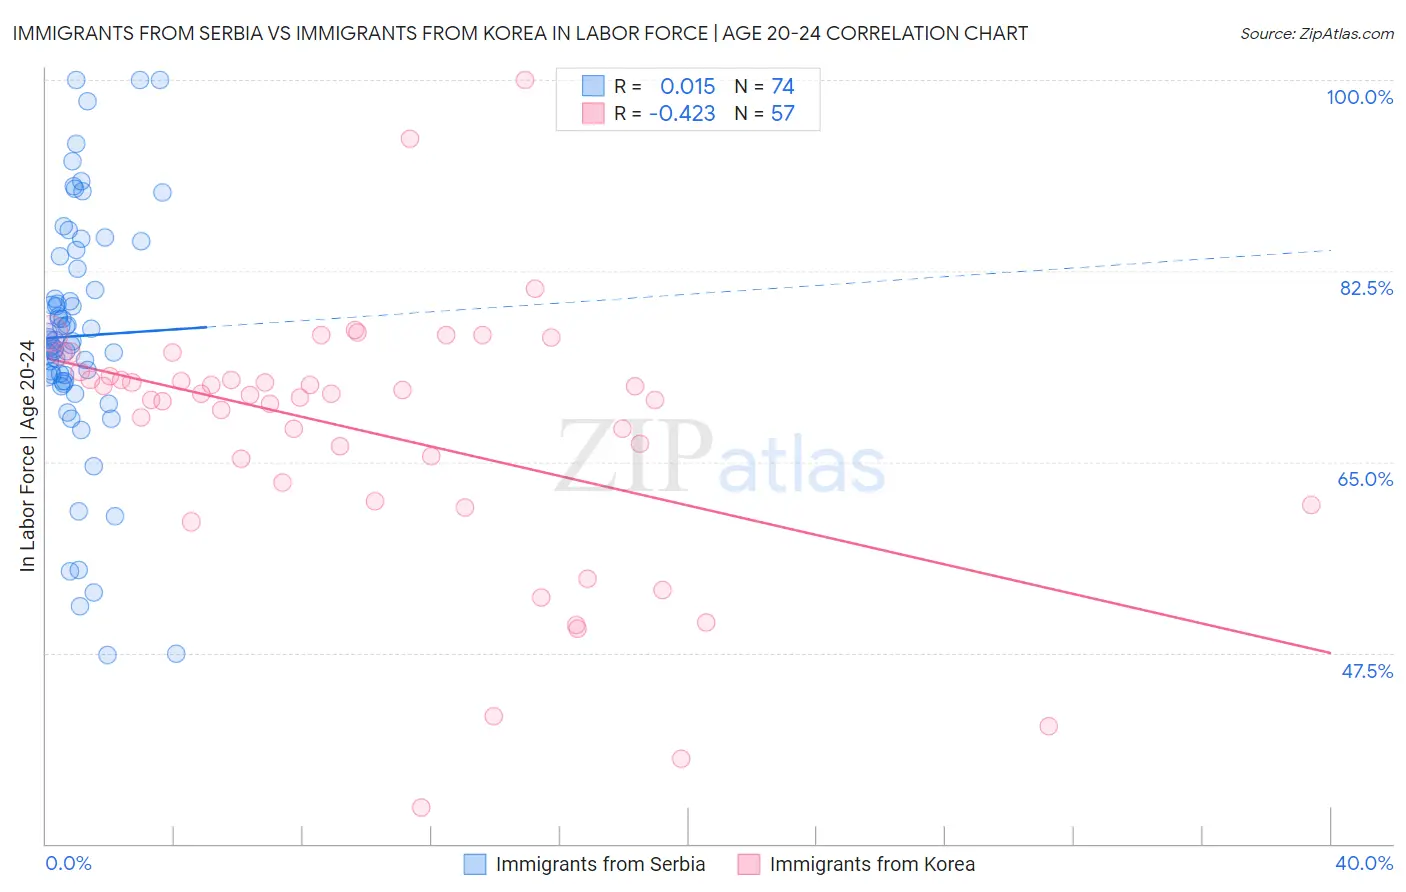
Immigrants from Serbia vs Immigrants from Korea In Labor Force | Age 20-24 Correlation Chart
The statistical analysis conducted on geographies consisting of 131,724,823 people shows no correlation between the proportion of Immigrants from Serbia and labor force participation rate among population between the ages 20 and 24 in the United States with a correlation coefficient (R) of 0.015 and weighted average of 75.8%. Similarly, the statistical analysis conducted on geographies consisting of 416,204,507 people shows a moderate negative correlation between the proportion of Immigrants from Korea and labor force participation rate among population between the ages 20 and 24 in the United States with a correlation coefficient (R) of -0.423 and weighted average of 73.1%, a difference of 3.7%.
In Labor Force | Age 20-24 Correlation Summary
| Measurement | Immigrants from Serbia | Immigrants from Korea |
| Minimum | 47.3% | 33.3% |
| Maximum | 100.0% | 100.0% |
| Range | 52.7% | 66.7% |
| Mean | 76.5% | 67.6% |
| Median | 76.1% | 71.1% |
| Interquartile 25% (IQ1) | 72.4% | 62.2% |
| Interquartile 75% (IQ3) | 82.7% | 73.1% |
| Interquartile Range (IQR) | 10.3% | 10.8% |
| Standard Deviation (Sample) | 11.2% | 12.2% |
| Standard Deviation (Population) | 11.2% | 12.1% |
Similar Demographics by In Labor Force | Age 20-24
Demographics Similar to Immigrants from Serbia by In Labor Force | Age 20-24
In terms of in labor force | age 20-24, the demographic groups most similar to Immigrants from Serbia are Pakistani (75.8%, a difference of 0.010%), Immigrants from Bulgaria (75.8%, a difference of 0.010%), Immigrants from Africa (75.8%, a difference of 0.030%), Immigrants from Sierra Leone (75.8%, a difference of 0.030%), and Spanish American (75.8%, a difference of 0.040%).
| Demographics | Rating | Rank | In Labor Force | Age 20-24 |
| Immigrants | Zimbabwe | 95.1 /100 | #114 | Exceptional 75.9% |
| Alaska Natives | 95.1 /100 | #115 | Exceptional 75.9% |
| Immigrants | North America | 95.0 /100 | #116 | Exceptional 75.9% |
| Assyrians/Chaldeans/Syriacs | 94.9 /100 | #117 | Exceptional 75.9% |
| Spanish Americans | 94.8 /100 | #118 | Exceptional 75.8% |
| Immigrants | Portugal | 94.8 /100 | #119 | Exceptional 75.8% |
| Immigrants | Africa | 94.6 /100 | #120 | Exceptional 75.8% |
| Immigrants | Serbia | 94.3 /100 | #121 | Exceptional 75.8% |
| Pakistanis | 94.1 /100 | #122 | Exceptional 75.8% |
| Immigrants | Bulgaria | 94.1 /100 | #123 | Exceptional 75.8% |
| Immigrants | Sierra Leone | 93.8 /100 | #124 | Exceptional 75.8% |
| Immigrants | Scotland | 93.7 /100 | #125 | Exceptional 75.8% |
| Brazilians | 93.0 /100 | #126 | Exceptional 75.8% |
| Sub-Saharan Africans | 90.9 /100 | #127 | Exceptional 75.7% |
| Immigrants | Afghanistan | 89.4 /100 | #128 | Excellent 75.6% |
Demographics Similar to Immigrants from Korea by In Labor Force | Age 20-24
In terms of in labor force | age 20-24, the demographic groups most similar to Immigrants from Korea are Immigrants from Lebanon (73.1%, a difference of 0.020%), Nicaraguan (73.2%, a difference of 0.050%), Argentinean (73.1%, a difference of 0.080%), Kiowa (73.2%, a difference of 0.11%), and U.S. Virgin Islander (73.0%, a difference of 0.11%).
| Demographics | Rating | Rank | In Labor Force | Age 20-24 |
| Bahamians | 0.1 /100 | #280 | Tragic 73.3% |
| Immigrants | Venezuela | 0.1 /100 | #281 | Tragic 73.2% |
| Immigrants | Spain | 0.1 /100 | #282 | Tragic 73.2% |
| Immigrants | Bahamas | 0.1 /100 | #283 | Tragic 73.2% |
| Kiowa | 0.1 /100 | #284 | Tragic 73.2% |
| Nicaraguans | 0.1 /100 | #285 | Tragic 73.2% |
| Immigrants | Lebanon | 0.1 /100 | #286 | Tragic 73.1% |
| Immigrants | Korea | 0.1 /100 | #287 | Tragic 73.1% |
| Argentineans | 0.1 /100 | #288 | Tragic 73.1% |
| U.S. Virgin Islanders | 0.1 /100 | #289 | Tragic 73.0% |
| Immigrants | Belarus | 0.1 /100 | #290 | Tragic 73.0% |
| Immigrants | Nicaragua | 0.0 /100 | #291 | Tragic 72.9% |
| Pueblo | 0.0 /100 | #292 | Tragic 72.9% |
| Immigrants | Belize | 0.0 /100 | #293 | Tragic 72.8% |
| Immigrants | Argentina | 0.0 /100 | #294 | Tragic 72.8% |