Immigrants from Jamaica vs Immigrants from Korea In Labor Force | Age 20-24
COMPARE
Immigrants from Jamaica
Immigrants from Korea
In Labor Force | Age 20-24
In Labor Force | Age 20-24 Comparison
Immigrants from Jamaica
Immigrants from Korea
72.4%
IN LABOR FORCE | AGE 20-24
0.0/ 100
METRIC RATING
306th/ 347
METRIC RANK
73.1%
IN LABOR FORCE | AGE 20-24
0.1/ 100
METRIC RATING
287th/ 347
METRIC RANK
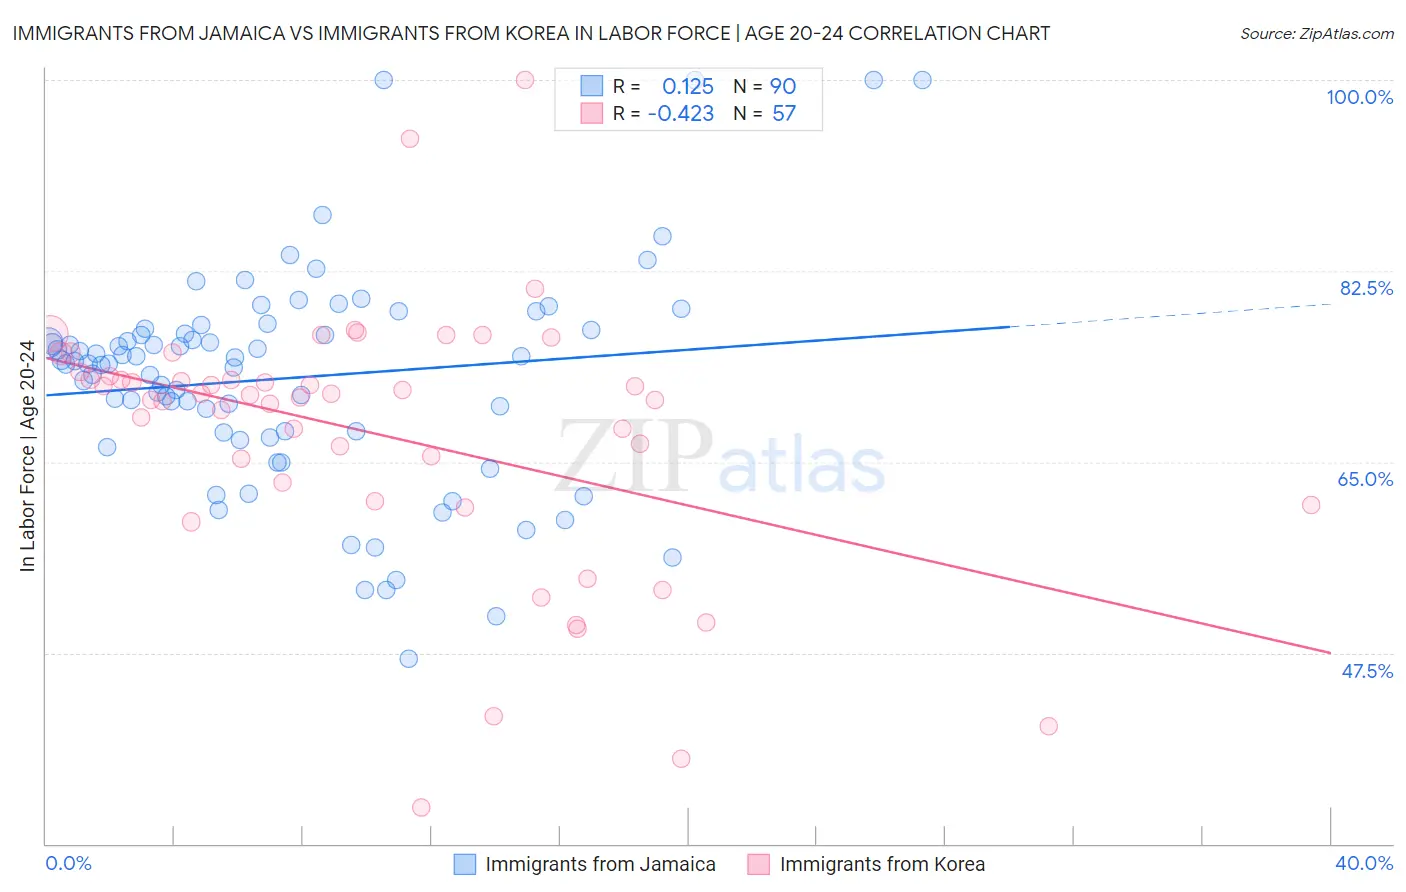
Immigrants from Jamaica vs Immigrants from Korea In Labor Force | Age 20-24 Correlation Chart
The statistical analysis conducted on geographies consisting of 301,749,902 people shows a poor positive correlation between the proportion of Immigrants from Jamaica and labor force participation rate among population between the ages 20 and 24 in the United States with a correlation coefficient (R) of 0.125 and weighted average of 72.4%. Similarly, the statistical analysis conducted on geographies consisting of 416,204,507 people shows a moderate negative correlation between the proportion of Immigrants from Korea and labor force participation rate among population between the ages 20 and 24 in the United States with a correlation coefficient (R) of -0.423 and weighted average of 73.1%, a difference of 1.0%.
In Labor Force | Age 20-24 Correlation Summary
| Measurement | Immigrants from Jamaica | Immigrants from Korea |
| Minimum | 46.9% | 33.3% |
| Maximum | 100.0% | 100.0% |
| Range | 53.1% | 66.7% |
| Mean | 72.7% | 67.6% |
| Median | 74.1% | 71.1% |
| Interquartile 25% (IQ1) | 67.7% | 62.2% |
| Interquartile 75% (IQ3) | 77.1% | 73.1% |
| Interquartile Range (IQR) | 9.4% | 10.8% |
| Standard Deviation (Sample) | 10.1% | 12.2% |
| Standard Deviation (Population) | 10.0% | 12.1% |
Demographics Similar to Immigrants from Jamaica and Immigrants from Korea by In Labor Force | Age 20-24
In terms of in labor force | age 20-24, the demographic groups most similar to Immigrants from Jamaica are Immigrants from Singapore (72.4%, a difference of 0.020%), Immigrants from West Indies (72.4%, a difference of 0.050%), Ecuadorian (72.4%, a difference of 0.060%), Native/Alaskan (72.4%, a difference of 0.070%), and Cuban (72.5%, a difference of 0.16%). Similarly, the demographic groups most similar to Immigrants from Korea are Immigrants from Lebanon (73.1%, a difference of 0.020%), Argentinean (73.1%, a difference of 0.080%), U.S. Virgin Islander (73.0%, a difference of 0.11%), Immigrants from Belarus (73.0%, a difference of 0.19%), and Immigrants from Nicaragua (72.9%, a difference of 0.27%).
| Demographics | Rating | Rank | In Labor Force | Age 20-24 |
| Immigrants | Lebanon | 0.1 /100 | #286 | Tragic 73.1% |
| Immigrants | Korea | 0.1 /100 | #287 | Tragic 73.1% |
| Argentineans | 0.1 /100 | #288 | Tragic 73.1% |
| U.S. Virgin Islanders | 0.1 /100 | #289 | Tragic 73.0% |
| Immigrants | Belarus | 0.1 /100 | #290 | Tragic 73.0% |
| Immigrants | Nicaragua | 0.0 /100 | #291 | Tragic 72.9% |
| Pueblo | 0.0 /100 | #292 | Tragic 72.9% |
| Immigrants | Belize | 0.0 /100 | #293 | Tragic 72.8% |
| Immigrants | Argentina | 0.0 /100 | #294 | Tragic 72.8% |
| Okinawans | 0.0 /100 | #295 | Tragic 72.7% |
| Jamaicans | 0.0 /100 | #296 | Tragic 72.7% |
| Central American Indians | 0.0 /100 | #297 | Tragic 72.7% |
| Israelis | 0.0 /100 | #298 | Tragic 72.6% |
| Iranians | 0.0 /100 | #299 | Tragic 72.6% |
| Armenians | 0.0 /100 | #300 | Tragic 72.5% |
| Cubans | 0.0 /100 | #301 | Tragic 72.5% |
| Natives/Alaskans | 0.0 /100 | #302 | Tragic 72.4% |
| Ecuadorians | 0.0 /100 | #303 | Tragic 72.4% |
| Immigrants | West Indies | 0.0 /100 | #304 | Tragic 72.4% |
| Immigrants | Singapore | 0.0 /100 | #305 | Tragic 72.4% |
| Immigrants | Jamaica | 0.0 /100 | #306 | Tragic 72.4% |