Immigrants from Albania vs Immigrants from Armenia In Labor Force | Age 20-24
COMPARE
Immigrants from Albania
Immigrants from Armenia
In Labor Force | Age 20-24
In Labor Force | Age 20-24 Comparison
Immigrants from Albania
Immigrants from Armenia
74.2%
IN LABOR FORCE | AGE 20-24
4.3/ 100
METRIC RATING
230th/ 347
METRIC RANK
71.7%
IN LABOR FORCE | AGE 20-24
0.0/ 100
METRIC RATING
317th/ 347
METRIC RANK
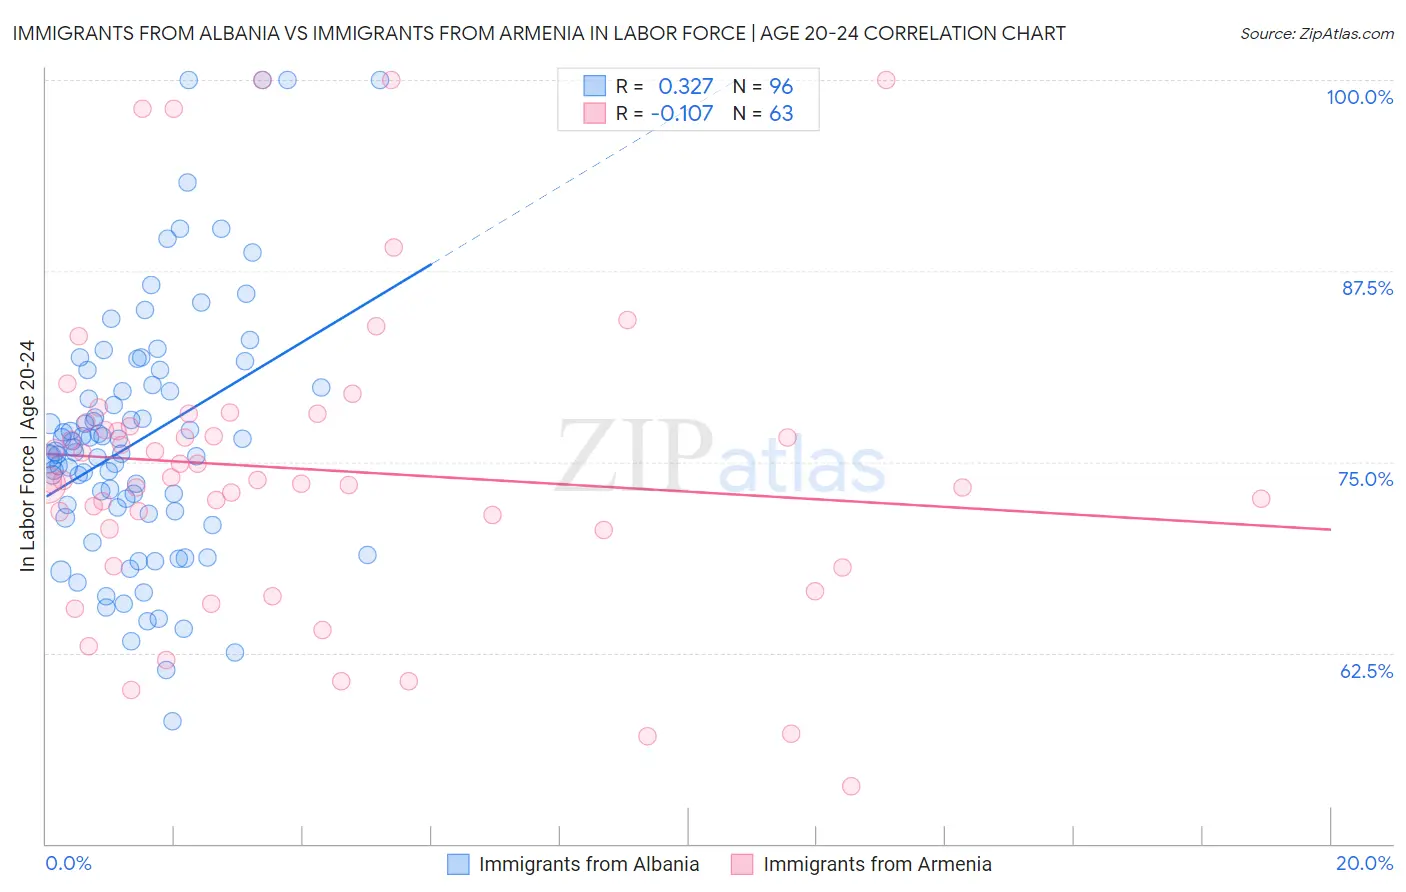
Immigrants from Albania vs Immigrants from Armenia In Labor Force | Age 20-24 Correlation Chart
The statistical analysis conducted on geographies consisting of 119,383,108 people shows a mild positive correlation between the proportion of Immigrants from Albania and labor force participation rate among population between the ages 20 and 24 in the United States with a correlation coefficient (R) of 0.327 and weighted average of 74.2%. Similarly, the statistical analysis conducted on geographies consisting of 97,714,117 people shows a poor negative correlation between the proportion of Immigrants from Armenia and labor force participation rate among population between the ages 20 and 24 in the United States with a correlation coefficient (R) of -0.107 and weighted average of 71.7%, a difference of 3.5%.
In Labor Force | Age 20-24 Correlation Summary
| Measurement | Immigrants from Albania | Immigrants from Armenia |
| Minimum | 58.0% | 53.8% |
| Maximum | 100.0% | 100.0% |
| Range | 42.0% | 46.2% |
| Mean | 76.4% | 74.6% |
| Median | 75.7% | 73.8% |
| Interquartile 25% (IQ1) | 71.7% | 70.5% |
| Interquartile 75% (IQ3) | 80.0% | 77.6% |
| Interquartile Range (IQR) | 8.3% | 7.1% |
| Standard Deviation (Sample) | 8.4% | 10.0% |
| Standard Deviation (Population) | 8.3% | 9.9% |
Similar Demographics by In Labor Force | Age 20-24
Demographics Similar to Immigrants from Albania by In Labor Force | Age 20-24
In terms of in labor force | age 20-24, the demographic groups most similar to Immigrants from Albania are Immigrants from Greece (74.2%, a difference of 0.020%), Immigrants from Switzerland (74.2%, a difference of 0.020%), Immigrants from Sweden (74.2%, a difference of 0.030%), Immigrants from Ukraine (74.2%, a difference of 0.060%), and Immigrants from Chile (74.1%, a difference of 0.060%).
| Demographics | Rating | Rank | In Labor Force | Age 20-24 |
| Hispanics or Latinos | 7.9 /100 | #223 | Tragic 74.4% |
| Seminole | 6.9 /100 | #224 | Tragic 74.3% |
| Ghanaians | 6.2 /100 | #225 | Tragic 74.3% |
| Immigrants | Fiji | 5.9 /100 | #226 | Tragic 74.3% |
| Immigrants | Ireland | 5.8 /100 | #227 | Tragic 74.3% |
| Immigrants | Ukraine | 5.1 /100 | #228 | Tragic 74.2% |
| Immigrants | Sweden | 4.6 /100 | #229 | Tragic 74.2% |
| Immigrants | Albania | 4.3 /100 | #230 | Tragic 74.2% |
| Immigrants | Greece | 4.1 /100 | #231 | Tragic 74.2% |
| Immigrants | Switzerland | 4.1 /100 | #232 | Tragic 74.2% |
| Immigrants | Chile | 3.7 /100 | #233 | Tragic 74.1% |
| Immigrants | Immigrants | 3.6 /100 | #234 | Tragic 74.1% |
| Laotians | 3.5 /100 | #235 | Tragic 74.1% |
| Immigrants | France | 3.3 /100 | #236 | Tragic 74.1% |
| Bermudans | 3.2 /100 | #237 | Tragic 74.1% |
Demographics Similar to Immigrants from Armenia by In Labor Force | Age 20-24
In terms of in labor force | age 20-24, the demographic groups most similar to Immigrants from Armenia are Immigrants from Hong Kong (71.6%, a difference of 0.090%), Immigrants from Israel (71.6%, a difference of 0.12%), Immigrants from Eastern Asia (71.8%, a difference of 0.17%), Trinidadian and Tobagonian (71.5%, a difference of 0.20%), and Immigrants from Iran (71.8%, a difference of 0.21%).
| Demographics | Rating | Rank | In Labor Force | Age 20-24 |
| Immigrants | Cuba | 0.0 /100 | #310 | Tragic 72.0% |
| Apache | 0.0 /100 | #311 | Tragic 72.0% |
| Immigrants | Caribbean | 0.0 /100 | #312 | Tragic 71.9% |
| Immigrants | Dominica | 0.0 /100 | #313 | Tragic 71.9% |
| Indians (Asian) | 0.0 /100 | #314 | Tragic 71.9% |
| Immigrants | Iran | 0.0 /100 | #315 | Tragic 71.8% |
| Immigrants | Eastern Asia | 0.0 /100 | #316 | Tragic 71.8% |
| Immigrants | Armenia | 0.0 /100 | #317 | Tragic 71.7% |
| Immigrants | Hong Kong | 0.0 /100 | #318 | Tragic 71.6% |
| Immigrants | Israel | 0.0 /100 | #319 | Tragic 71.6% |
| Trinidadians and Tobagonians | 0.0 /100 | #320 | Tragic 71.5% |
| Immigrants | Taiwan | 0.0 /100 | #321 | Tragic 71.5% |
| Filipinos | 0.0 /100 | #322 | Tragic 71.4% |
| West Indians | 0.0 /100 | #323 | Tragic 71.3% |
| Immigrants | Dominican Republic | 0.0 /100 | #324 | Tragic 71.2% |