Immigrants from Africa vs Senegalese In Labor Force | Age 45-54
COMPARE
Immigrants from Africa
Senegalese
In Labor Force | Age 45-54
In Labor Force | Age 45-54 Comparison
Immigrants from Africa
Senegalese
83.2%
IN LABOR FORCE | AGE 45-54
92.6/ 100
METRIC RATING
110th/ 347
METRIC RANK
82.4%
IN LABOR FORCE | AGE 45-54
9.5/ 100
METRIC RATING
205th/ 347
METRIC RANK
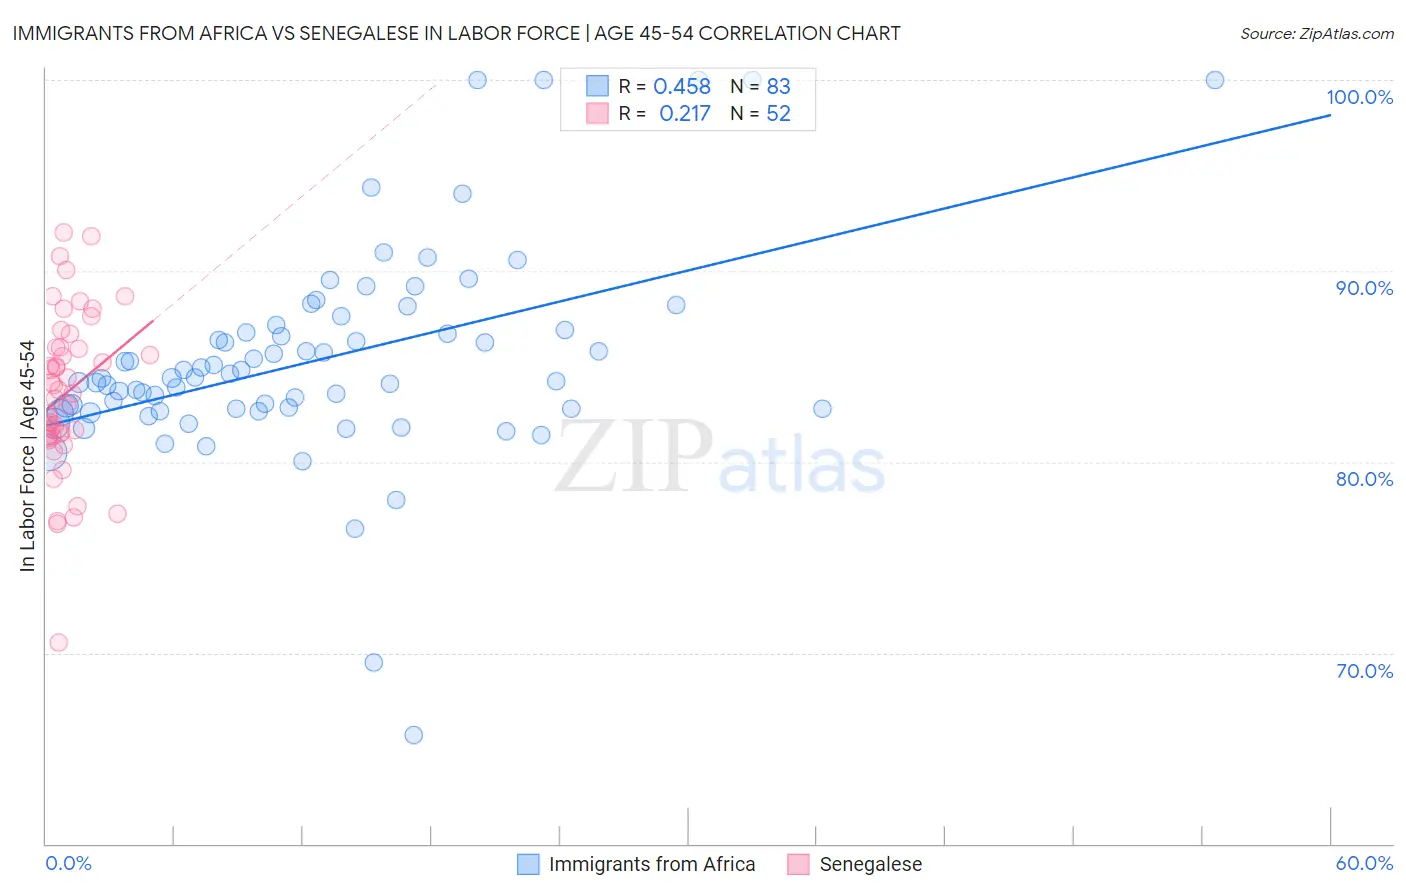
Immigrants from Africa vs Senegalese In Labor Force | Age 45-54 Correlation Chart
The statistical analysis conducted on geographies consisting of 468,907,137 people shows a moderate positive correlation between the proportion of Immigrants from Africa and labor force participation rate among population between the ages 45 and 54 in the United States with a correlation coefficient (R) of 0.458 and weighted average of 83.2%. Similarly, the statistical analysis conducted on geographies consisting of 78,115,825 people shows a weak positive correlation between the proportion of Senegalese and labor force participation rate among population between the ages 45 and 54 in the United States with a correlation coefficient (R) of 0.217 and weighted average of 82.4%, a difference of 1.1%.
In Labor Force | Age 45-54 Correlation Summary
| Measurement | Immigrants from Africa | Senegalese |
| Minimum | 65.7% | 70.5% |
| Maximum | 100.0% | 92.0% |
| Range | 34.3% | 21.5% |
| Mean | 85.3% | 83.6% |
| Median | 84.4% | 83.7% |
| Interquartile 25% (IQ1) | 82.8% | 81.4% |
| Interquartile 75% (IQ3) | 86.9% | 86.0% |
| Interquartile Range (IQR) | 4.1% | 4.6% |
| Standard Deviation (Sample) | 5.5% | 4.2% |
| Standard Deviation (Population) | 5.5% | 4.1% |
Similar Demographics by In Labor Force | Age 45-54
Demographics Similar to Immigrants from Africa by In Labor Force | Age 45-54
In terms of in labor force | age 45-54, the demographic groups most similar to Immigrants from Africa are Slovak (83.2%, a difference of 0.0%), Ukrainian (83.2%, a difference of 0.0%), Immigrants from Italy (83.2%, a difference of 0.0%), Iranian (83.2%, a difference of 0.010%), and Immigrants from Afghanistan (83.2%, a difference of 0.010%).
| Demographics | Rating | Rank | In Labor Force | Age 45-54 |
| Albanians | 93.9 /100 | #103 | Exceptional 83.3% |
| Immigrants | Romania | 93.8 /100 | #104 | Exceptional 83.3% |
| Immigrants | South America | 93.5 /100 | #105 | Exceptional 83.2% |
| Sri Lankans | 93.2 /100 | #106 | Exceptional 83.2% |
| Iranians | 92.9 /100 | #107 | Exceptional 83.2% |
| Slovaks | 92.8 /100 | #108 | Exceptional 83.2% |
| Ukrainians | 92.7 /100 | #109 | Exceptional 83.2% |
| Immigrants | Africa | 92.6 /100 | #110 | Exceptional 83.2% |
| Immigrants | Italy | 92.5 /100 | #111 | Exceptional 83.2% |
| Immigrants | Afghanistan | 92.4 /100 | #112 | Exceptional 83.2% |
| Immigrants | Albania | 91.8 /100 | #113 | Exceptional 83.2% |
| Assyrians/Chaldeans/Syriacs | 91.7 /100 | #114 | Exceptional 83.2% |
| Immigrants | Chile | 91.6 /100 | #115 | Exceptional 83.2% |
| Immigrants | Malaysia | 91.4 /100 | #116 | Exceptional 83.2% |
| Immigrants | China | 90.9 /100 | #117 | Exceptional 83.2% |
Demographics Similar to Senegalese by In Labor Force | Age 45-54
In terms of in labor force | age 45-54, the demographic groups most similar to Senegalese are Welsh (82.3%, a difference of 0.010%), Immigrants from Western Europe (82.4%, a difference of 0.030%), Immigrants from Cabo Verde (82.3%, a difference of 0.030%), Native Hawaiian (82.3%, a difference of 0.030%), and Arab (82.4%, a difference of 0.050%).
| Demographics | Rating | Rank | In Labor Force | Age 45-54 |
| Immigrants | Denmark | 17.9 /100 | #198 | Poor 82.5% |
| Moroccans | 15.7 /100 | #199 | Poor 82.5% |
| French Canadians | 15.4 /100 | #200 | Poor 82.5% |
| Canadians | 15.1 /100 | #201 | Poor 82.4% |
| Immigrants | Western Asia | 14.9 /100 | #202 | Poor 82.4% |
| Arabs | 11.6 /100 | #203 | Poor 82.4% |
| Immigrants | Western Europe | 10.9 /100 | #204 | Poor 82.4% |
| Senegalese | 9.5 /100 | #205 | Tragic 82.4% |
| Welsh | 9.2 /100 | #206 | Tragic 82.3% |
| Immigrants | Cabo Verde | 8.6 /100 | #207 | Tragic 82.3% |
| Native Hawaiians | 8.5 /100 | #208 | Tragic 82.3% |
| Immigrants | Lebanon | 7.4 /100 | #209 | Tragic 82.3% |
| Immigrants | Bahamas | 7.1 /100 | #210 | Tragic 82.3% |
| Immigrants | Syria | 6.6 /100 | #211 | Tragic 82.3% |
| Ecuadorians | 6.3 /100 | #212 | Tragic 82.3% |