Immigrants from Afghanistan vs Irish Doctorate Degree
COMPARE
Immigrants from Afghanistan
Irish
Doctorate Degree
Doctorate Degree Comparison
Immigrants from Afghanistan
Irish
1.8%
DOCTORATE DEGREE
44.3/ 100
METRIC RATING
182nd/ 347
METRIC RANK
1.9%
DOCTORATE DEGREE
67.5/ 100
METRIC RATING
162nd/ 347
METRIC RANK
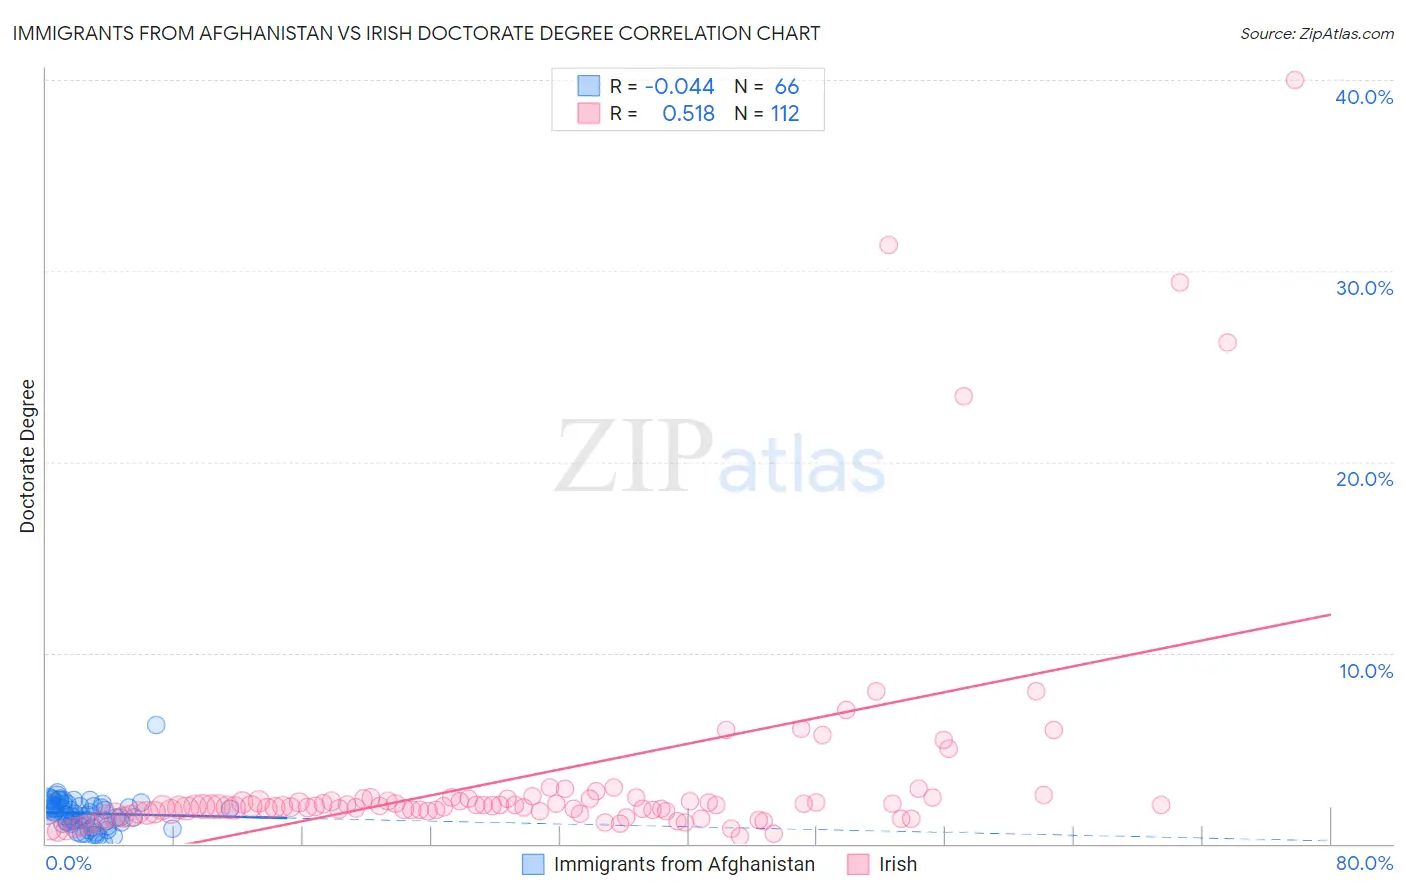
Immigrants from Afghanistan vs Irish Doctorate Degree Correlation Chart
The statistical analysis conducted on geographies consisting of 147,399,207 people shows no correlation between the proportion of Immigrants from Afghanistan and percentage of population with at least doctorate degree education in the United States with a correlation coefficient (R) of -0.044 and weighted average of 1.8%. Similarly, the statistical analysis conducted on geographies consisting of 550,861,641 people shows a substantial positive correlation between the proportion of Irish and percentage of population with at least doctorate degree education in the United States with a correlation coefficient (R) of 0.518 and weighted average of 1.9%, a difference of 3.5%.
Doctorate Degree Correlation Summary
| Measurement | Immigrants from Afghanistan | Irish |
| Minimum | 0.038% | 0.38% |
| Maximum | 6.2% | 40.0% |
| Range | 6.2% | 39.6% |
| Mean | 1.6% | 3.4% |
| Median | 1.6% | 2.0% |
| Interquartile 25% (IQ1) | 1.1% | 1.7% |
| Interquartile 75% (IQ3) | 2.0% | 2.3% |
| Interquartile Range (IQR) | 0.88% | 0.66% |
| Standard Deviation (Sample) | 0.86% | 6.1% |
| Standard Deviation (Population) | 0.85% | 6.0% |
Demographics Similar to Immigrants from Afghanistan and Irish by Doctorate Degree
In terms of doctorate degree, the demographic groups most similar to Immigrants from Afghanistan are Immigrants (1.8%, a difference of 0.29%), Scandinavian (1.8%, a difference of 0.55%), Ghanaian (1.8%, a difference of 0.60%), French (1.8%, a difference of 0.67%), and Iraqi (1.8%, a difference of 0.74%). Similarly, the demographic groups most similar to Irish are Czech (1.9%, a difference of 0.040%), Celtic (1.9%, a difference of 0.13%), Scotch-Irish (1.9%, a difference of 0.62%), Spaniard (1.9%, a difference of 0.64%), and Macedonian (1.9%, a difference of 1.0%).
| Demographics | Rating | Rank | Doctorate Degree |
| Irish | 67.5 /100 | #162 | Good 1.9% |
| Czechs | 67.3 /100 | #163 | Good 1.9% |
| Celtics | 66.7 /100 | #164 | Good 1.9% |
| Scotch-Irish | 63.6 /100 | #165 | Good 1.9% |
| Spaniards | 63.5 /100 | #166 | Good 1.9% |
| Macedonians | 60.9 /100 | #167 | Good 1.9% |
| Sri Lankans | 60.3 /100 | #168 | Good 1.9% |
| Vietnamese | 54.8 /100 | #169 | Average 1.9% |
| Costa Ricans | 53.3 /100 | #170 | Average 1.8% |
| Bermudans | 52.1 /100 | #171 | Average 1.8% |
| Belgians | 50.3 /100 | #172 | Average 1.8% |
| Norwegians | 50.0 /100 | #173 | Average 1.8% |
| Immigrants | Bangladesh | 50.0 /100 | #174 | Average 1.8% |
| Immigrants | Thailand | 49.4 /100 | #175 | Average 1.8% |
| Spanish | 49.3 /100 | #176 | Average 1.8% |
| Iraqis | 49.2 /100 | #177 | Average 1.8% |
| French | 48.8 /100 | #178 | Average 1.8% |
| Ghanaians | 48.3 /100 | #179 | Average 1.8% |
| Scandinavians | 48.0 /100 | #180 | Average 1.8% |
| Immigrants | Immigrants | 46.2 /100 | #181 | Average 1.8% |
| Immigrants | Afghanistan | 44.3 /100 | #182 | Average 1.8% |