Icelander vs Immigrants from Iraq In Labor Force | Age 20-24
COMPARE
Icelander
Immigrants from Iraq
In Labor Force | Age 20-24
In Labor Force | Age 20-24 Comparison
Icelanders
Immigrants from Iraq
76.9%
IN LABOR FORCE | AGE 20-24
99.9/ 100
METRIC RATING
66th/ 347
METRIC RANK
76.4%
IN LABOR FORCE | AGE 20-24
99.3/ 100
METRIC RATING
86th/ 347
METRIC RANK
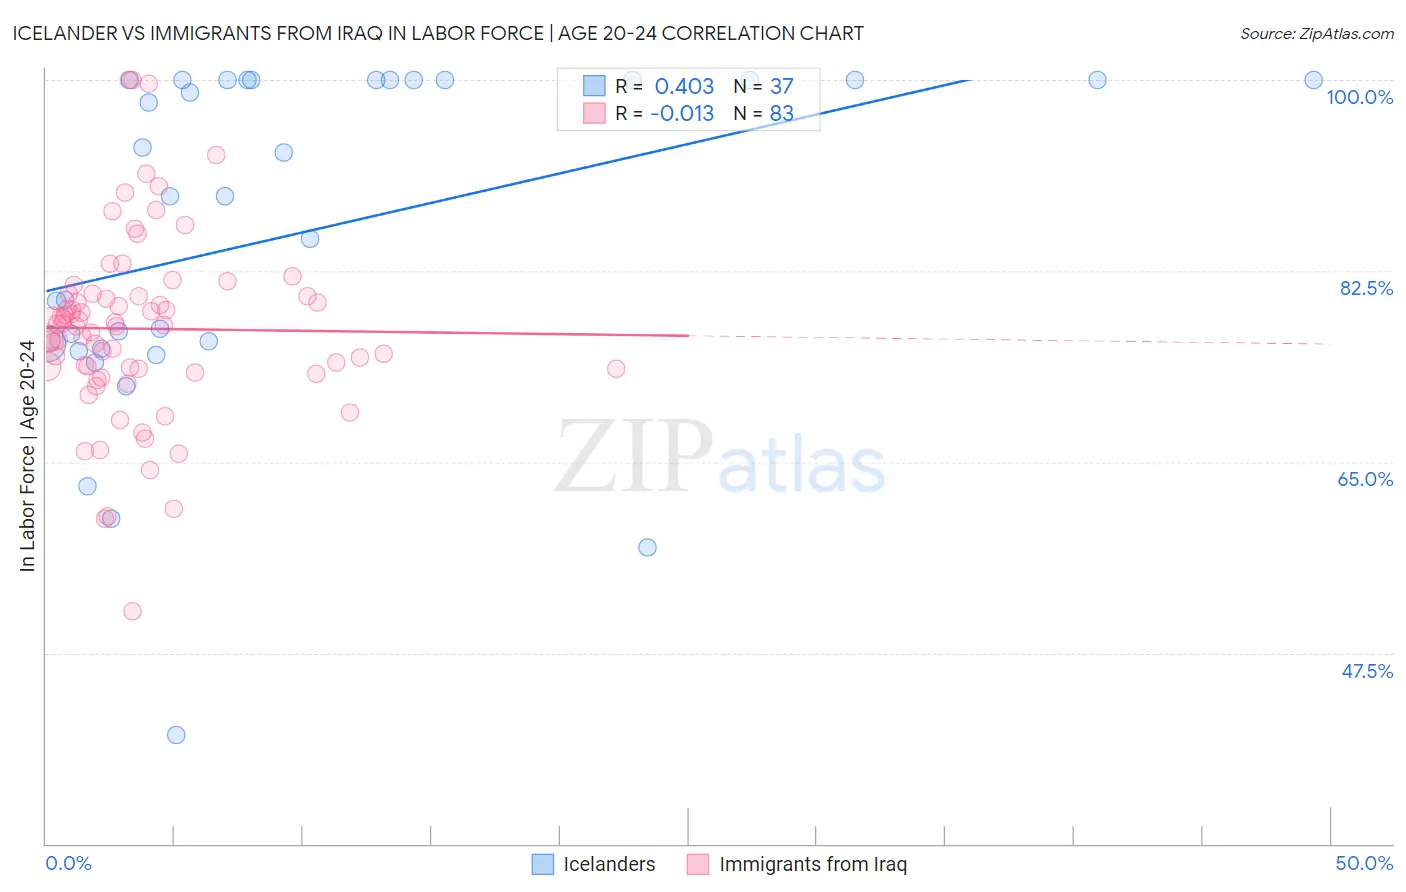
Icelander vs Immigrants from Iraq In Labor Force | Age 20-24 Correlation Chart
The statistical analysis conducted on geographies consisting of 159,597,296 people shows a moderate positive correlation between the proportion of Icelanders and labor force participation rate among population between the ages 20 and 24 in the United States with a correlation coefficient (R) of 0.403 and weighted average of 76.9%. Similarly, the statistical analysis conducted on geographies consisting of 194,771,125 people shows no correlation between the proportion of Immigrants from Iraq and labor force participation rate among population between the ages 20 and 24 in the United States with a correlation coefficient (R) of -0.013 and weighted average of 76.4%, a difference of 0.60%.
In Labor Force | Age 20-24 Correlation Summary
| Measurement | Icelander | Immigrants from Iraq |
| Minimum | 40.0% | 51.3% |
| Maximum | 100.0% | 100.0% |
| Range | 60.0% | 48.7% |
| Mean | 86.0% | 77.2% |
| Median | 89.3% | 77.5% |
| Interquartile 25% (IQ1) | 75.6% | 73.5% |
| Interquartile 75% (IQ3) | 100.0% | 80.2% |
| Interquartile Range (IQR) | 24.4% | 6.7% |
| Standard Deviation (Sample) | 15.4% | 8.4% |
| Standard Deviation (Population) | 15.2% | 8.4% |
Demographics Similar to Icelanders and Immigrants from Iraq by In Labor Force | Age 20-24
In terms of in labor force | age 20-24, the demographic groups most similar to Icelanders are Slavic (76.9%, a difference of 0.010%), French American Indian (76.8%, a difference of 0.040%), Immigrants from Sudan (76.8%, a difference of 0.060%), Ottawa (76.8%, a difference of 0.070%), and Northern European (76.8%, a difference of 0.14%). Similarly, the demographic groups most similar to Immigrants from Iraq are Portuguese (76.4%, a difference of 0.030%), Austrian (76.5%, a difference of 0.050%), Carpatho Rusyn (76.5%, a difference of 0.060%), Basque (76.5%, a difference of 0.15%), and Hmong (76.5%, a difference of 0.15%).
| Demographics | Rating | Rank | In Labor Force | Age 20-24 |
| Icelanders | 99.9 /100 | #66 | Exceptional 76.9% |
| Slavs | 99.9 /100 | #67 | Exceptional 76.9% |
| French American Indians | 99.8 /100 | #68 | Exceptional 76.8% |
| Immigrants | Sudan | 99.8 /100 | #69 | Exceptional 76.8% |
| Ottawa | 99.8 /100 | #70 | Exceptional 76.8% |
| Northern Europeans | 99.8 /100 | #71 | Exceptional 76.8% |
| Guamanians/Chamorros | 99.8 /100 | #72 | Exceptional 76.7% |
| British | 99.8 /100 | #73 | Exceptional 76.7% |
| Cree | 99.7 /100 | #74 | Exceptional 76.6% |
| Immigrants | Middle Africa | 99.7 /100 | #75 | Exceptional 76.6% |
| Immigrants | Moldova | 99.6 /100 | #76 | Exceptional 76.6% |
| Immigrants | Cameroon | 99.6 /100 | #77 | Exceptional 76.6% |
| Canadians | 99.6 /100 | #78 | Exceptional 76.6% |
| Immigrants | Zaire | 99.6 /100 | #79 | Exceptional 76.6% |
| Italians | 99.6 /100 | #80 | Exceptional 76.5% |
| Basques | 99.5 /100 | #81 | Exceptional 76.5% |
| Hmong | 99.5 /100 | #82 | Exceptional 76.5% |
| Carpatho Rusyns | 99.4 /100 | #83 | Exceptional 76.5% |
| Austrians | 99.4 /100 | #84 | Exceptional 76.5% |
| Portuguese | 99.3 /100 | #85 | Exceptional 76.4% |
| Immigrants | Iraq | 99.3 /100 | #86 | Exceptional 76.4% |