Trinidadian and Tobagonian vs Canadian In Labor Force | Age > 16
COMPARE
Trinidadian and Tobagonian
Canadian
In Labor Force | Age > 16
In Labor Force | Age > 16 Comparison
Trinidadians and Tobagonians
Canadians
65.1%
IN LABOR FORCE | AGE > 16
45.2/ 100
METRIC RATING
178th/ 347
METRIC RANK
64.1%
IN LABOR FORCE | AGE > 16
0.5/ 100
METRIC RATING
267th/ 347
METRIC RANK
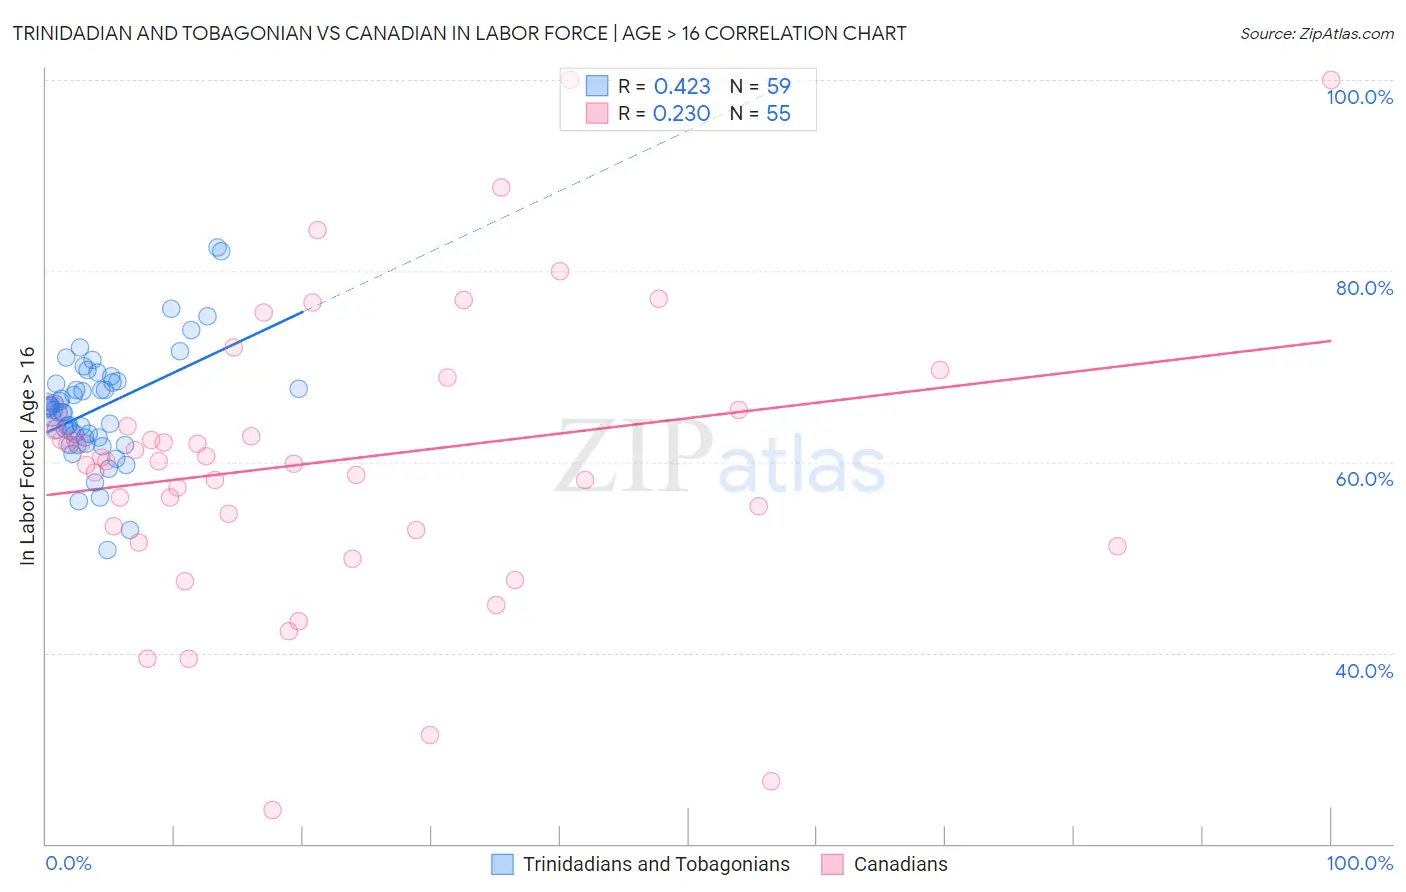
Trinidadian and Tobagonian vs Canadian In Labor Force | Age > 16 Correlation Chart
The statistical analysis conducted on geographies consisting of 219,884,780 people shows a moderate positive correlation between the proportion of Trinidadians and Tobagonians and labor force participation rate among population ages 16 and over in the United States with a correlation coefficient (R) of 0.423 and weighted average of 65.1%. Similarly, the statistical analysis conducted on geographies consisting of 437,567,270 people shows a weak positive correlation between the proportion of Canadians and labor force participation rate among population ages 16 and over in the United States with a correlation coefficient (R) of 0.230 and weighted average of 64.1%, a difference of 1.5%.
In Labor Force | Age > 16 Correlation Summary
| Measurement | Trinidadian and Tobagonian | Canadian |
| Minimum | 50.8% | 23.5% |
| Maximum | 82.4% | 100.0% |
| Range | 31.6% | 76.5% |
| Mean | 65.6% | 60.1% |
| Median | 65.5% | 60.1% |
| Interquartile 25% (IQ1) | 62.5% | 52.8% |
| Interquartile 75% (IQ3) | 68.3% | 65.0% |
| Interquartile Range (IQR) | 5.8% | 12.2% |
| Standard Deviation (Sample) | 5.8% | 15.1% |
| Standard Deviation (Population) | 5.7% | 14.9% |
Similar Demographics by In Labor Force | Age > 16
Demographics Similar to Trinidadians and Tobagonians by In Labor Force | Age > 16
In terms of in labor force | age > 16, the demographic groups most similar to Trinidadians and Tobagonians are Eastern European (65.1%, a difference of 0.010%), Immigrants from Haiti (65.1%, a difference of 0.020%), Swedish (65.1%, a difference of 0.030%), Immigrants from Latvia (65.1%, a difference of 0.030%), and Immigrants from Panama (65.1%, a difference of 0.030%).
| Demographics | Rating | Rank | In Labor Force | Age > 16 |
| Israelis | 61.6 /100 | #171 | Good 65.2% |
| Immigrants | Sweden | 61.3 /100 | #172 | Good 65.2% |
| Immigrants | Ukraine | 53.7 /100 | #173 | Average 65.1% |
| Macedonians | 50.0 /100 | #174 | Average 65.1% |
| Nicaraguans | 49.7 /100 | #175 | Average 65.1% |
| Swedes | 47.4 /100 | #176 | Average 65.1% |
| Eastern Europeans | 46.2 /100 | #177 | Average 65.1% |
| Trinidadians and Tobagonians | 45.2 /100 | #178 | Average 65.1% |
| Immigrants | Haiti | 43.3 /100 | #179 | Average 65.1% |
| Immigrants | Latvia | 42.9 /100 | #180 | Average 65.1% |
| Immigrants | Panama | 42.4 /100 | #181 | Average 65.1% |
| Immigrants | Nicaragua | 41.1 /100 | #182 | Average 65.1% |
| Soviet Union | 40.5 /100 | #183 | Average 65.0% |
| Carpatho Rusyns | 40.0 /100 | #184 | Average 65.0% |
| Syrians | 40.0 /100 | #185 | Average 65.0% |
Demographics Similar to Canadians by In Labor Force | Age > 16
In terms of in labor force | age > 16, the demographic groups most similar to Canadians are Spaniard (64.1%, a difference of 0.0%), Immigrants from England (64.2%, a difference of 0.010%), Cuban (64.2%, a difference of 0.020%), Irish (64.1%, a difference of 0.040%), and Dutch (64.2%, a difference of 0.060%).
| Demographics | Rating | Rank | In Labor Force | Age > 16 |
| Marshallese | 0.7 /100 | #260 | Tragic 64.2% |
| Basques | 0.7 /100 | #261 | Tragic 64.2% |
| Finns | 0.7 /100 | #262 | Tragic 64.2% |
| Bahamians | 0.6 /100 | #263 | Tragic 64.2% |
| Dutch | 0.6 /100 | #264 | Tragic 64.2% |
| Cubans | 0.5 /100 | #265 | Tragic 64.2% |
| Immigrants | England | 0.5 /100 | #266 | Tragic 64.2% |
| Canadians | 0.5 /100 | #267 | Tragic 64.1% |
| Spaniards | 0.5 /100 | #268 | Tragic 64.1% |
| Irish | 0.4 /100 | #269 | Tragic 64.1% |
| Guyanese | 0.4 /100 | #270 | Tragic 64.1% |
| Dominicans | 0.4 /100 | #271 | Tragic 64.1% |
| Native Hawaiians | 0.3 /100 | #272 | Tragic 64.1% |
| Hmong | 0.3 /100 | #273 | Tragic 64.1% |
| Immigrants | Cuba | 0.3 /100 | #274 | Tragic 64.1% |