Cajun vs Belgian In Labor Force | Age 20-64
COMPARE
Cajun
Belgian
In Labor Force | Age 20-64
In Labor Force | Age 20-64 Comparison
Cajuns
Belgians
75.5%
IN LABOR FORCE | AGE 20-64
0.0/ 100
METRIC RATING
323rd/ 347
METRIC RANK
79.9%
IN LABOR FORCE | AGE 20-64
87.4/ 100
METRIC RATING
134th/ 347
METRIC RANK
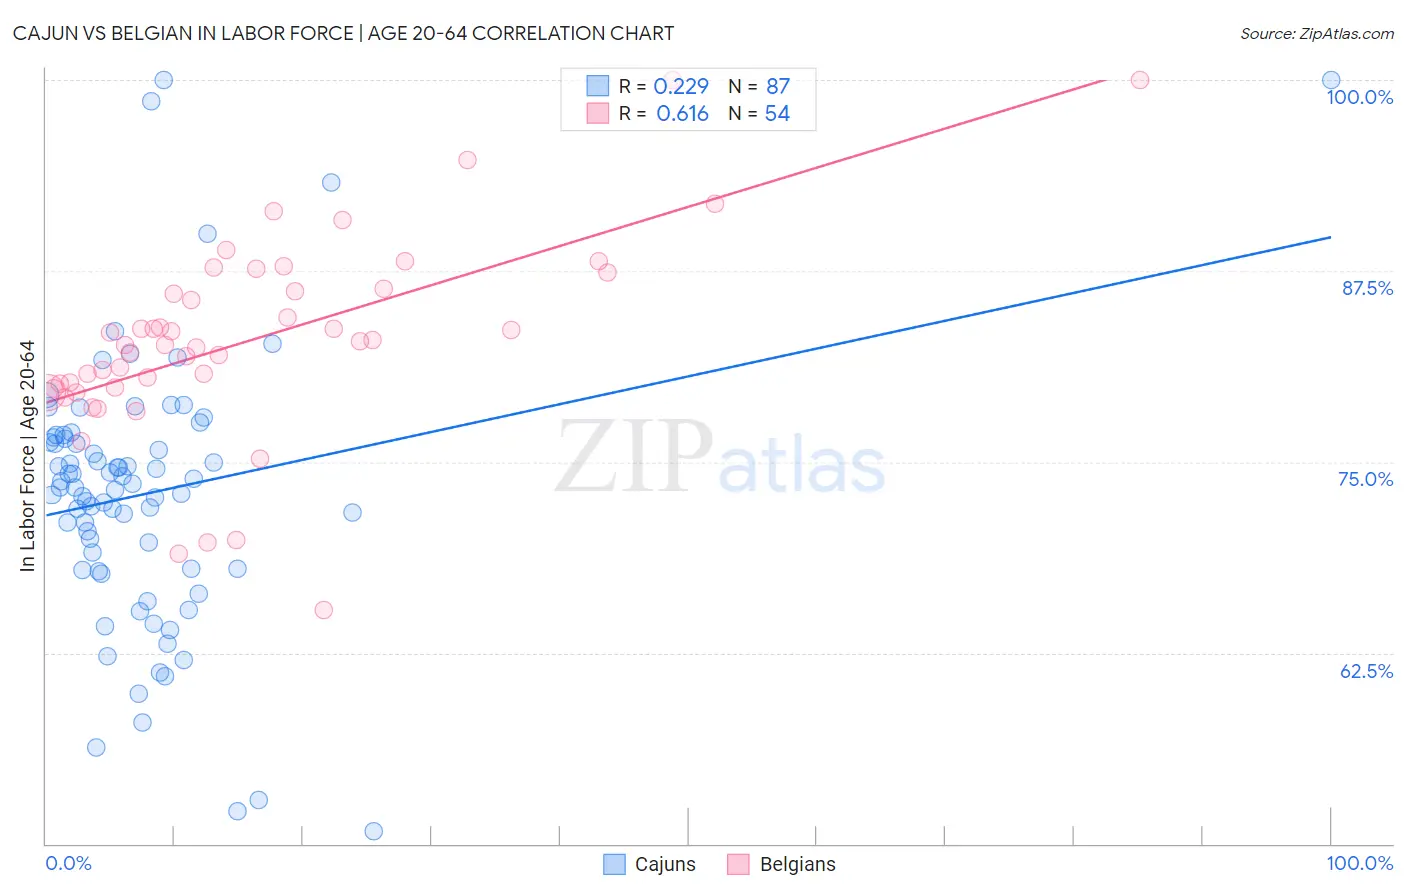
Cajun vs Belgian In Labor Force | Age 20-64 Correlation Chart
The statistical analysis conducted on geographies consisting of 149,713,173 people shows a weak positive correlation between the proportion of Cajuns and labor force participation rate among population between the ages 20 and 64 in the United States with a correlation coefficient (R) of 0.229 and weighted average of 75.5%. Similarly, the statistical analysis conducted on geographies consisting of 356,033,088 people shows a significant positive correlation between the proportion of Belgians and labor force participation rate among population between the ages 20 and 64 in the United States with a correlation coefficient (R) of 0.616 and weighted average of 79.9%, a difference of 5.9%.
In Labor Force | Age 20-64 Correlation Summary
| Measurement | Cajun | Belgian |
| Minimum | 50.8% | 65.3% |
| Maximum | 100.0% | 100.0% |
| Range | 49.2% | 34.7% |
| Mean | 72.9% | 83.0% |
| Median | 73.4% | 82.8% |
| Interquartile 25% (IQ1) | 68.0% | 79.9% |
| Interquartile 75% (IQ3) | 76.6% | 86.3% |
| Interquartile Range (IQR) | 8.6% | 6.4% |
| Standard Deviation (Sample) | 9.0% | 6.5% |
| Standard Deviation (Population) | 8.9% | 6.5% |
Similar Demographics by In Labor Force | Age 20-64
Demographics Similar to Cajuns by In Labor Force | Age 20-64
In terms of in labor force | age 20-64, the demographic groups most similar to Cajuns are Dutch West Indian (75.5%, a difference of 0.040%), Choctaw (75.4%, a difference of 0.060%), Seminole (75.5%, a difference of 0.090%), Menominee (75.3%, a difference of 0.19%), and Creek (75.1%, a difference of 0.42%).
| Demographics | Rating | Rank | In Labor Force | Age 20-64 |
| Yaqui | 0.0 /100 | #316 | Tragic 76.5% |
| Cherokee | 0.0 /100 | #317 | Tragic 76.2% |
| Chickasaw | 0.0 /100 | #318 | Tragic 76.2% |
| Inupiat | 0.0 /100 | #319 | Tragic 76.1% |
| Yakama | 0.0 /100 | #320 | Tragic 75.8% |
| Seminole | 0.0 /100 | #321 | Tragic 75.5% |
| Dutch West Indians | 0.0 /100 | #322 | Tragic 75.5% |
| Cajuns | 0.0 /100 | #323 | Tragic 75.5% |
| Choctaw | 0.0 /100 | #324 | Tragic 75.4% |
| Menominee | 0.0 /100 | #325 | Tragic 75.3% |
| Creek | 0.0 /100 | #326 | Tragic 75.1% |
| Sioux | 0.0 /100 | #327 | Tragic 75.0% |
| Kiowa | 0.0 /100 | #328 | Tragic 75.0% |
| Cheyenne | 0.0 /100 | #329 | Tragic 74.8% |
| Colville | 0.0 /100 | #330 | Tragic 74.8% |
Demographics Similar to Belgians by In Labor Force | Age 20-64
In terms of in labor force | age 20-64, the demographic groups most similar to Belgians are Indian (Asian) (79.9%, a difference of 0.0%), South American Indian (79.9%, a difference of 0.0%), Ukrainian (79.9%, a difference of 0.010%), Immigrants from Singapore (79.9%, a difference of 0.010%), and Immigrants from Zaire (79.9%, a difference of 0.020%).
| Demographics | Rating | Rank | In Labor Force | Age 20-64 |
| Immigrants | Czechoslovakia | 89.7 /100 | #127 | Excellent 79.9% |
| Immigrants | Eastern Asia | 89.4 /100 | #128 | Excellent 79.9% |
| Italians | 88.9 /100 | #129 | Excellent 79.9% |
| Immigrants | Zaire | 88.6 /100 | #130 | Excellent 79.9% |
| Immigrants | Iran | 88.3 /100 | #131 | Excellent 79.9% |
| Indians (Asian) | 87.7 /100 | #132 | Excellent 79.9% |
| South American Indians | 87.6 /100 | #133 | Excellent 79.9% |
| Belgians | 87.4 /100 | #134 | Excellent 79.9% |
| Ukrainians | 86.8 /100 | #135 | Excellent 79.9% |
| Immigrants | Singapore | 86.7 /100 | #136 | Excellent 79.9% |
| Immigrants | Ukraine | 86.5 /100 | #137 | Excellent 79.9% |
| Immigrants | Nigeria | 86.4 /100 | #138 | Excellent 79.9% |
| Immigrants | Spain | 83.9 /100 | #139 | Excellent 79.8% |
| Immigrants | South Eastern Asia | 80.4 /100 | #140 | Excellent 79.8% |
| Immigrants | Israel | 80.0 /100 | #141 | Good 79.8% |