Hopi vs Salvadoran In Labor Force | Age 25-29
COMPARE
Hopi
Salvadoran
In Labor Force | Age 25-29
In Labor Force | Age 25-29 Comparison
Hopi
Salvadorans
76.5%
IN LABOR FORCE | AGE 25-29
0.0/ 100
METRIC RATING
344th/ 347
METRIC RANK
83.8%
IN LABOR FORCE | AGE 25-29
0.5/ 100
METRIC RATING
243rd/ 347
METRIC RANK
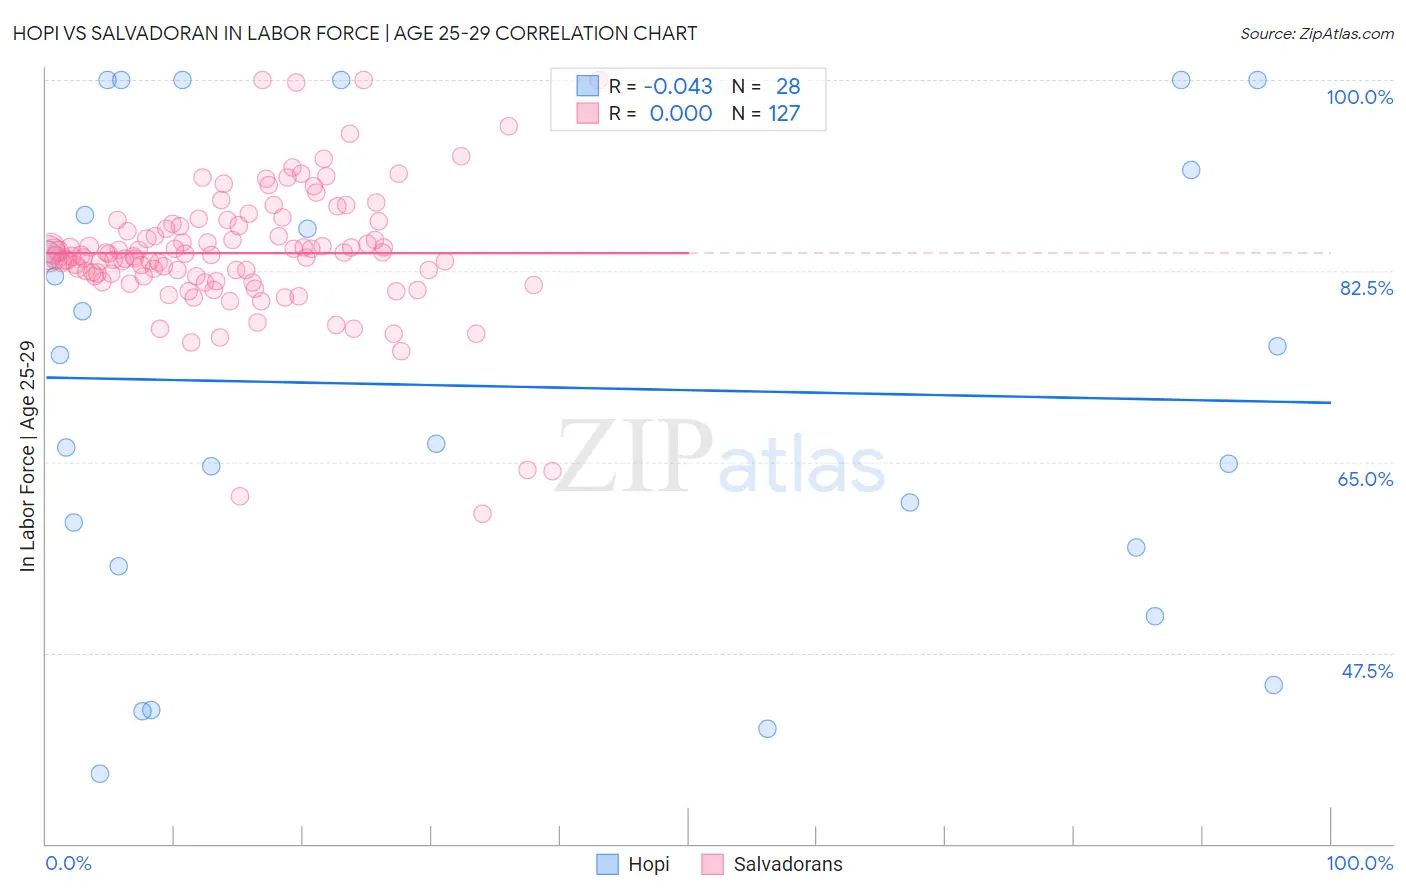
Hopi vs Salvadoran In Labor Force | Age 25-29 Correlation Chart
The statistical analysis conducted on geographies consisting of 74,722,734 people shows no correlation between the proportion of Hopi and labor force participation rate among population between the ages 25 and 29 in the United States with a correlation coefficient (R) of -0.043 and weighted average of 76.5%. Similarly, the statistical analysis conducted on geographies consisting of 398,899,857 people shows no correlation between the proportion of Salvadorans and labor force participation rate among population between the ages 25 and 29 in the United States with a correlation coefficient (R) of 0.000 and weighted average of 83.8%, a difference of 9.6%.
In Labor Force | Age 25-29 Correlation Summary
| Measurement | Hopi | Salvadoran |
| Minimum | 36.4% | 60.2% |
| Maximum | 100.0% | 100.0% |
| Range | 63.6% | 39.8% |
| Mean | 71.9% | 84.1% |
| Median | 70.8% | 84.0% |
| Interquartile 25% (IQ1) | 56.3% | 82.0% |
| Interquartile 75% (IQ3) | 89.7% | 86.7% |
| Interquartile Range (IQR) | 33.4% | 4.6% |
| Standard Deviation (Sample) | 21.1% | 6.1% |
| Standard Deviation (Population) | 20.7% | 6.1% |
Similar Demographics by In Labor Force | Age 25-29
Demographics Similar to Hopi by In Labor Force | Age 25-29
In terms of in labor force | age 25-29, the demographic groups most similar to Hopi are Arapaho (76.6%, a difference of 0.060%), Pueblo (77.5%, a difference of 1.3%), Tohono O'odham (77.5%, a difference of 1.3%), Paiute (78.1%, a difference of 2.1%), and Immigrants from Yemen (78.2%, a difference of 2.2%).
| Demographics | Rating | Rank | In Labor Force | Age 25-29 |
| Sioux | 0.0 /100 | #333 | Tragic 79.7% |
| Yuman | 0.0 /100 | #334 | Tragic 79.3% |
| Natives/Alaskans | 0.0 /100 | #335 | Tragic 79.3% |
| Apache | 0.0 /100 | #336 | Tragic 79.2% |
| Crow | 0.0 /100 | #337 | Tragic 78.6% |
| Lumbee | 0.0 /100 | #338 | Tragic 78.3% |
| Immigrants | Yemen | 0.0 /100 | #339 | Tragic 78.2% |
| Paiute | 0.0 /100 | #340 | Tragic 78.1% |
| Tohono O'odham | 0.0 /100 | #341 | Tragic 77.5% |
| Pueblo | 0.0 /100 | #342 | Tragic 77.5% |
| Arapaho | 0.0 /100 | #343 | Tragic 76.6% |
| Hopi | 0.0 /100 | #344 | Tragic 76.5% |
| Navajo | 0.0 /100 | #345 | Tragic 74.6% |
| Pima | 0.0 /100 | #346 | Tragic 74.3% |
| Yup'ik | 0.0 /100 | #347 | Tragic 73.1% |
Demographics Similar to Salvadorans by In Labor Force | Age 25-29
In terms of in labor force | age 25-29, the demographic groups most similar to Salvadorans are U.S. Virgin Islander (83.8%, a difference of 0.010%), Alsatian (83.9%, a difference of 0.040%), Immigrants from Jamaica (83.8%, a difference of 0.040%), Iroquois (83.8%, a difference of 0.040%), and Jamaican (83.9%, a difference of 0.070%).
| Demographics | Rating | Rank | In Labor Force | Age 25-29 |
| Guamanians/Chamorros | 0.9 /100 | #236 | Tragic 83.9% |
| Immigrants | Immigrants | 0.9 /100 | #237 | Tragic 83.9% |
| Immigrants | Uzbekistan | 0.8 /100 | #238 | Tragic 83.9% |
| Jamaicans | 0.8 /100 | #239 | Tragic 83.9% |
| Trinidadians and Tobagonians | 0.7 /100 | #240 | Tragic 83.9% |
| Alsatians | 0.7 /100 | #241 | Tragic 83.9% |
| U.S. Virgin Islanders | 0.6 /100 | #242 | Tragic 83.8% |
| Salvadorans | 0.5 /100 | #243 | Tragic 83.8% |
| Immigrants | Jamaica | 0.4 /100 | #244 | Tragic 83.8% |
| Iroquois | 0.4 /100 | #245 | Tragic 83.8% |
| Cree | 0.3 /100 | #246 | Tragic 83.8% |
| Immigrants | El Salvador | 0.3 /100 | #247 | Tragic 83.7% |
| Immigrants | Nonimmigrants | 0.3 /100 | #248 | Tragic 83.7% |
| Hmong | 0.3 /100 | #249 | Tragic 83.7% |
| Central Americans | 0.2 /100 | #250 | Tragic 83.7% |