Immigrants from Spain vs Swedish In Labor Force | Age 35-44
COMPARE
Immigrants from Spain
Swedish
In Labor Force | Age 35-44
In Labor Force | Age 35-44 Comparison
Immigrants from Spain
Swedes
84.7%
IN LABOR FORCE | AGE 35-44
90.6/ 100
METRIC RATING
127th/ 347
METRIC RANK
85.0%
IN LABOR FORCE | AGE 35-44
99.2/ 100
METRIC RATING
64th/ 347
METRIC RANK
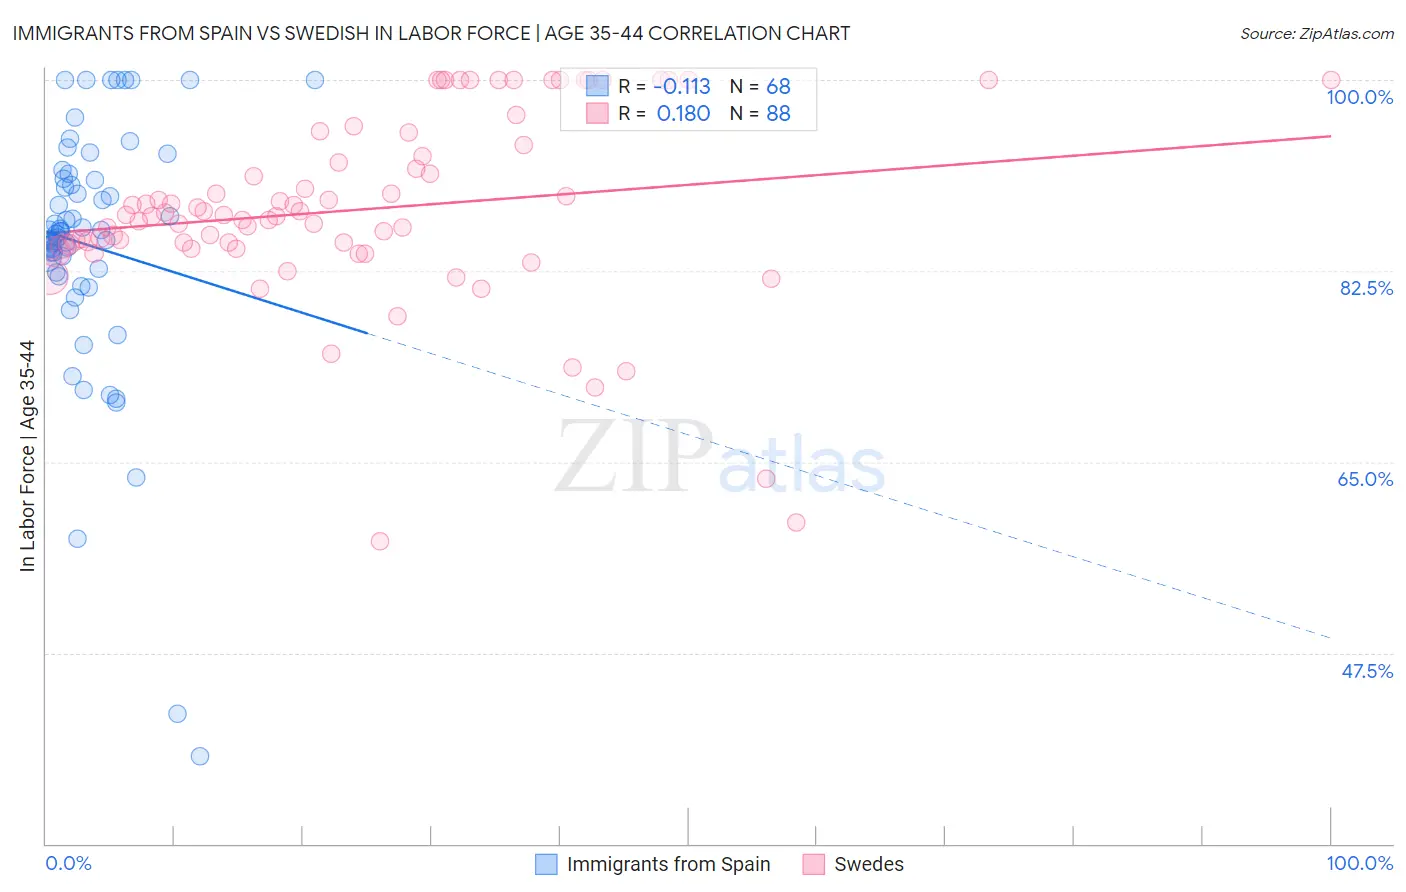
Immigrants from Spain vs Swedish In Labor Force | Age 35-44 Correlation Chart
The statistical analysis conducted on geographies consisting of 239,621,275 people shows a poor negative correlation between the proportion of Immigrants from Spain and labor force participation rate among population between the ages 35 and 44 in the United States with a correlation coefficient (R) of -0.113 and weighted average of 84.7%. Similarly, the statistical analysis conducted on geographies consisting of 538,724,566 people shows a poor positive correlation between the proportion of Swedes and labor force participation rate among population between the ages 35 and 44 in the United States with a correlation coefficient (R) of 0.180 and weighted average of 85.0%, a difference of 0.42%.
In Labor Force | Age 35-44 Correlation Summary
| Measurement | Immigrants from Spain | Swedish |
| Minimum | 38.0% | 57.7% |
| Maximum | 100.0% | 100.0% |
| Range | 62.0% | 42.3% |
| Mean | 84.9% | 88.1% |
| Median | 86.0% | 87.6% |
| Interquartile 25% (IQ1) | 82.5% | 84.9% |
| Interquartile 75% (IQ3) | 90.9% | 93.5% |
| Interquartile Range (IQR) | 8.4% | 8.6% |
| Standard Deviation (Sample) | 11.7% | 8.7% |
| Standard Deviation (Population) | 11.6% | 8.6% |
Similar Demographics by In Labor Force | Age 35-44
Demographics Similar to Immigrants from Spain by In Labor Force | Age 35-44
In terms of in labor force | age 35-44, the demographic groups most similar to Immigrants from Spain are Slavic (84.7%, a difference of 0.0%), Maltese (84.7%, a difference of 0.0%), Asian (84.7%, a difference of 0.0%), Immigrants from Ghana (84.7%, a difference of 0.0%), and Finnish (84.7%, a difference of 0.010%).
| Demographics | Rating | Rank | In Labor Force | Age 35-44 |
| Immigrants | Northern Europe | 91.5 /100 | #120 | Exceptional 84.7% |
| Finns | 91.2 /100 | #121 | Exceptional 84.7% |
| Germans | 91.0 /100 | #122 | Exceptional 84.7% |
| Immigrants | South America | 90.9 /100 | #123 | Exceptional 84.7% |
| Slavs | 90.8 /100 | #124 | Exceptional 84.7% |
| Maltese | 90.8 /100 | #125 | Exceptional 84.7% |
| Asians | 90.6 /100 | #126 | Exceptional 84.7% |
| Immigrants | Spain | 90.6 /100 | #127 | Exceptional 84.7% |
| Immigrants | Ghana | 90.4 /100 | #128 | Exceptional 84.7% |
| Palestinians | 89.7 /100 | #129 | Excellent 84.7% |
| Bhutanese | 89.7 /100 | #130 | Excellent 84.7% |
| Immigrants | Scotland | 89.6 /100 | #131 | Excellent 84.7% |
| Austrians | 89.4 /100 | #132 | Excellent 84.7% |
| Argentineans | 88.4 /100 | #133 | Excellent 84.6% |
| Immigrants | Korea | 88.2 /100 | #134 | Excellent 84.6% |
Demographics Similar to Swedes by In Labor Force | Age 35-44
In terms of in labor force | age 35-44, the demographic groups most similar to Swedes are Immigrants from Moldova (85.0%, a difference of 0.010%), Immigrants from Uganda (85.0%, a difference of 0.010%), Immigrants from Brazil (85.0%, a difference of 0.010%), Immigrants from Latvia (85.0%, a difference of 0.020%), and Immigrants from Haiti (85.0%, a difference of 0.020%).
| Demographics | Rating | Rank | In Labor Force | Age 35-44 |
| Chinese | 99.4 /100 | #57 | Exceptional 85.1% |
| Slovaks | 99.4 /100 | #58 | Exceptional 85.1% |
| Serbians | 99.4 /100 | #59 | Exceptional 85.1% |
| Albanians | 99.4 /100 | #60 | Exceptional 85.1% |
| Immigrants | Latvia | 99.3 /100 | #61 | Exceptional 85.0% |
| Immigrants | Moldova | 99.3 /100 | #62 | Exceptional 85.0% |
| Immigrants | Uganda | 99.3 /100 | #63 | Exceptional 85.0% |
| Swedes | 99.2 /100 | #64 | Exceptional 85.0% |
| Immigrants | Brazil | 99.2 /100 | #65 | Exceptional 85.0% |
| Immigrants | Haiti | 99.1 /100 | #66 | Exceptional 85.0% |
| Immigrants | Italy | 99.1 /100 | #67 | Exceptional 85.0% |
| Italians | 99.1 /100 | #68 | Exceptional 85.0% |
| Sudanese | 99.0 /100 | #69 | Exceptional 85.0% |
| Brazilians | 99.0 /100 | #70 | Exceptional 85.0% |
| Russians | 99.0 /100 | #71 | Exceptional 85.0% |