Hmong vs Immigrants from Korea Median Earnings
COMPARE
Hmong
Immigrants from Korea
Median Earnings
Median Earnings Comparison
Hmong
Immigrants from Korea
$42,111
MEDIAN EARNINGS
0.2/ 100
METRIC RATING
280th/ 347
METRIC RANK
$54,530
MEDIAN EARNINGS
100.0/ 100
METRIC RATING
22nd/ 347
METRIC RANK
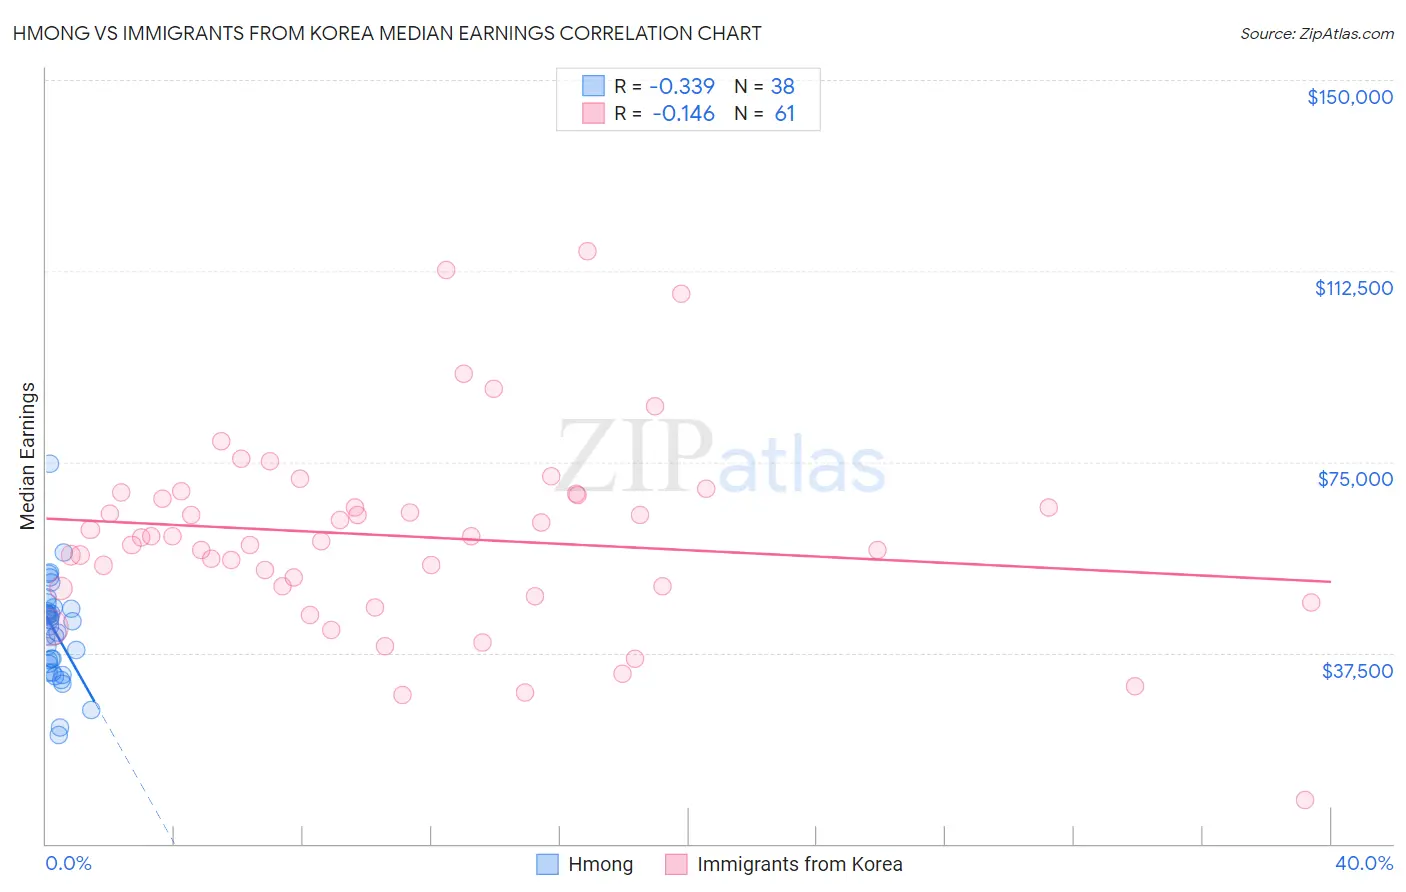
Hmong vs Immigrants from Korea Median Earnings Correlation Chart
The statistical analysis conducted on geographies consisting of 24,671,308 people shows a mild negative correlation between the proportion of Hmong and median earnings in the United States with a correlation coefficient (R) of -0.339 and weighted average of $42,111. Similarly, the statistical analysis conducted on geographies consisting of 416,330,492 people shows a poor negative correlation between the proportion of Immigrants from Korea and median earnings in the United States with a correlation coefficient (R) of -0.146 and weighted average of $54,530, a difference of 29.5%.
Median Earnings Correlation Summary
| Measurement | Hmong | Immigrants from Korea |
| Minimum | $21,250 | $8,707 |
| Maximum | $74,741 | $116,380 |
| Range | $53,491 | $107,673 |
| Mean | $41,764 | $60,321 |
| Median | $43,269 | $60,242 |
| Interquartile 25% (IQ1) | $35,451 | $50,376 |
| Interquartile 75% (IQ3) | $46,136 | $68,586 |
| Interquartile Range (IQR) | $10,685 | $18,211 |
| Standard Deviation (Sample) | $9,945 | $19,123 |
| Standard Deviation (Population) | $9,814 | $18,966 |
Similar Demographics by Median Earnings
Demographics Similar to Hmong by Median Earnings
In terms of median earnings, the demographic groups most similar to Hmong are Colville ($42,151, a difference of 0.10%), Cajun ($42,189, a difference of 0.19%), Marshallese ($41,969, a difference of 0.34%), African ($41,955, a difference of 0.37%), and Central American ($42,280, a difference of 0.40%).
| Demographics | Rating | Rank | Median Earnings |
| Immigrants | Dominica | 0.4 /100 | #273 | Tragic $42,420 |
| Immigrants | El Salvador | 0.4 /100 | #274 | Tragic $42,413 |
| Immigrants | Belize | 0.3 /100 | #275 | Tragic $42,339 |
| Spanish Americans | 0.3 /100 | #276 | Tragic $42,316 |
| Central Americans | 0.3 /100 | #277 | Tragic $42,280 |
| Cajuns | 0.3 /100 | #278 | Tragic $42,189 |
| Colville | 0.2 /100 | #279 | Tragic $42,151 |
| Hmong | 0.2 /100 | #280 | Tragic $42,111 |
| Marshallese | 0.2 /100 | #281 | Tragic $41,969 |
| Africans | 0.2 /100 | #282 | Tragic $41,955 |
| Dominicans | 0.2 /100 | #283 | Tragic $41,864 |
| Blackfeet | 0.2 /100 | #284 | Tragic $41,822 |
| Immigrants | Nicaragua | 0.1 /100 | #285 | Tragic $41,737 |
| Mexican American Indians | 0.1 /100 | #286 | Tragic $41,719 |
| Indonesians | 0.1 /100 | #287 | Tragic $41,701 |
Demographics Similar to Immigrants from Korea by Median Earnings
In terms of median earnings, the demographic groups most similar to Immigrants from Korea are Burmese ($54,559, a difference of 0.050%), Immigrants from Sweden ($54,478, a difference of 0.10%), Cypriot ($54,589, a difference of 0.11%), Immigrants from Belgium ($54,679, a difference of 0.27%), and Soviet Union ($54,290, a difference of 0.44%).
| Demographics | Rating | Rank | Median Earnings |
| Indians (Asian) | 100.0 /100 | #15 | Exceptional $56,253 |
| Immigrants | Eastern Asia | 100.0 /100 | #16 | Exceptional $56,183 |
| Eastern Europeans | 100.0 /100 | #17 | Exceptional $55,084 |
| Immigrants | Japan | 100.0 /100 | #18 | Exceptional $54,938 |
| Immigrants | Belgium | 100.0 /100 | #19 | Exceptional $54,679 |
| Cypriots | 100.0 /100 | #20 | Exceptional $54,589 |
| Burmese | 100.0 /100 | #21 | Exceptional $54,559 |
| Immigrants | Korea | 100.0 /100 | #22 | Exceptional $54,530 |
| Immigrants | Sweden | 100.0 /100 | #23 | Exceptional $54,478 |
| Soviet Union | 100.0 /100 | #24 | Exceptional $54,290 |
| Turks | 100.0 /100 | #25 | Exceptional $53,919 |
| Immigrants | Northern Europe | 100.0 /100 | #26 | Exceptional $53,872 |
| Asians | 100.0 /100 | #27 | Exceptional $53,690 |
| Immigrants | France | 100.0 /100 | #28 | Exceptional $53,490 |
| Immigrants | Russia | 100.0 /100 | #29 | Exceptional $53,457 |