Hmong vs Immigrants from Barbados Disability Age 35 to 64
COMPARE
Hmong
Immigrants from Barbados
Disability Age 35 to 64
Disability Age 35 to 64 Comparison
Hmong
Immigrants from Barbados
13.1%
DISABILITY AGE 35 TO 64
0.0/ 100
METRIC RATING
286th/ 347
METRIC RANK
11.3%
DISABILITY AGE 35 TO 64
41.6/ 100
METRIC RATING
179th/ 347
METRIC RANK
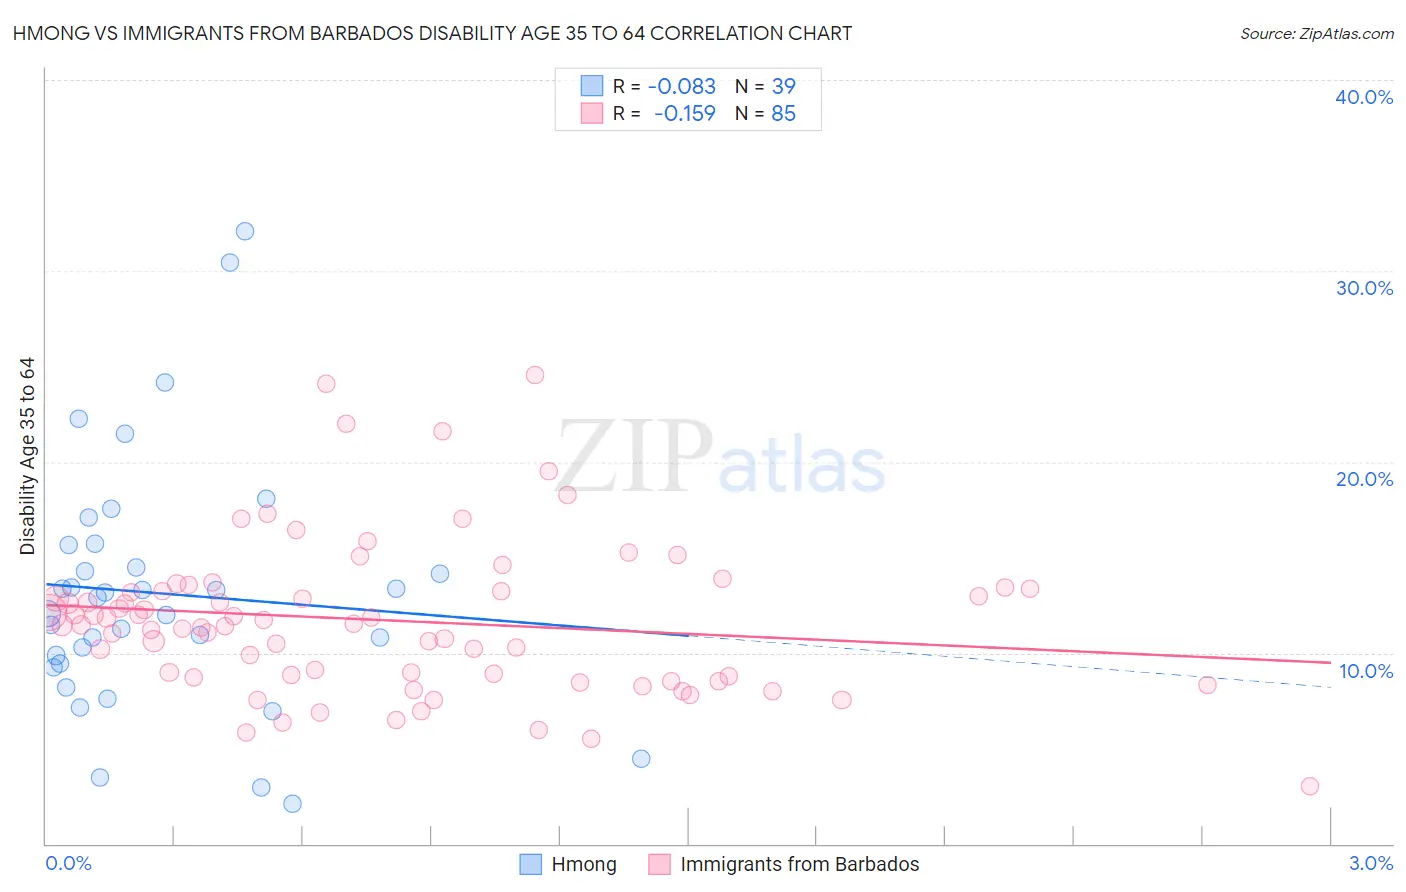
Hmong vs Immigrants from Barbados Disability Age 35 to 64 Correlation Chart
The statistical analysis conducted on geographies consisting of 24,678,157 people shows a slight negative correlation between the proportion of Hmong and percentage of population with a disability between the ages 34 and 64 in the United States with a correlation coefficient (R) of -0.083 and weighted average of 13.1%. Similarly, the statistical analysis conducted on geographies consisting of 112,766,273 people shows a poor negative correlation between the proportion of Immigrants from Barbados and percentage of population with a disability between the ages 34 and 64 in the United States with a correlation coefficient (R) of -0.159 and weighted average of 11.3%, a difference of 15.8%.
Disability Age 35 to 64 Correlation Summary
| Measurement | Hmong | Immigrants from Barbados |
| Minimum | 2.1% | 3.0% |
| Maximum | 32.0% | 24.6% |
| Range | 29.9% | 21.5% |
| Mean | 13.1% | 11.7% |
| Median | 12.9% | 11.5% |
| Interquartile 25% (IQ1) | 9.4% | 8.7% |
| Interquartile 75% (IQ3) | 15.6% | 13.3% |
| Interquartile Range (IQR) | 6.2% | 4.5% |
| Standard Deviation (Sample) | 6.5% | 4.0% |
| Standard Deviation (Population) | 6.4% | 4.0% |
Similar Demographics by Disability Age 35 to 64
Demographics Similar to Hmong by Disability Age 35 to 64
In terms of disability age 35 to 64, the demographic groups most similar to Hmong are Tlingit-Haida (13.2%, a difference of 0.27%), Immigrants from Somalia (13.1%, a difference of 0.31%), Fijian (13.2%, a difference of 0.62%), Indonesian (13.2%, a difference of 0.69%), and Nonimmigrants (13.0%, a difference of 0.75%).
| Demographics | Rating | Rank | Disability Age 35 to 64 |
| Immigrants | Micronesia | 0.1 /100 | #279 | Tragic 12.9% |
| Liberians | 0.1 /100 | #280 | Tragic 12.9% |
| Scotch-Irish | 0.1 /100 | #281 | Tragic 13.0% |
| Immigrants | Laos | 0.1 /100 | #282 | Tragic 13.0% |
| Central American Indians | 0.0 /100 | #283 | Tragic 13.0% |
| Immigrants | Nonimmigrants | 0.0 /100 | #284 | Tragic 13.0% |
| Immigrants | Somalia | 0.0 /100 | #285 | Tragic 13.1% |
| Hmong | 0.0 /100 | #286 | Tragic 13.1% |
| Tlingit-Haida | 0.0 /100 | #287 | Tragic 13.2% |
| Fijians | 0.0 /100 | #288 | Tragic 13.2% |
| Indonesians | 0.0 /100 | #289 | Tragic 13.2% |
| Immigrants | Liberia | 0.0 /100 | #290 | Tragic 13.2% |
| Immigrants | Congo | 0.0 /100 | #291 | Tragic 13.3% |
| Puget Sound Salish | 0.0 /100 | #292 | Tragic 13.3% |
| Ute | 0.0 /100 | #293 | Tragic 13.4% |
Demographics Similar to Immigrants from Barbados by Disability Age 35 to 64
In terms of disability age 35 to 64, the demographic groups most similar to Immigrants from Barbados are Immigrants from Caribbean (11.3%, a difference of 0.0%), Polish (11.3%, a difference of 0.040%), Immigrants from Eastern Africa (11.3%, a difference of 0.060%), Trinidadian and Tobagonian (11.4%, a difference of 0.070%), and Icelander (11.4%, a difference of 0.15%).
| Demographics | Rating | Rank | Disability Age 35 to 64 |
| Italians | 55.6 /100 | #172 | Average 11.2% |
| Lebanese | 51.8 /100 | #173 | Average 11.3% |
| Immigrants | Fiji | 50.0 /100 | #174 | Average 11.3% |
| Czechs | 47.9 /100 | #175 | Average 11.3% |
| Ugandans | 43.7 /100 | #176 | Average 11.3% |
| Immigrants | Eastern Africa | 42.2 /100 | #177 | Average 11.3% |
| Poles | 42.0 /100 | #178 | Average 11.3% |
| Immigrants | Barbados | 41.6 /100 | #179 | Average 11.3% |
| Immigrants | Caribbean | 41.5 /100 | #180 | Average 11.3% |
| Trinidadians and Tobagonians | 40.8 /100 | #181 | Average 11.4% |
| Icelanders | 39.7 /100 | #182 | Fair 11.4% |
| Immigrants | Oceania | 39.5 /100 | #183 | Fair 11.4% |
| Kenyans | 39.2 /100 | #184 | Fair 11.4% |
| Danes | 36.8 /100 | #185 | Fair 11.4% |
| Slovenes | 36.6 /100 | #186 | Fair 11.4% |