Hispanic or Latino vs Canadian In Labor Force | Age 16-19
COMPARE
Hispanic or Latino
Canadian
In Labor Force | Age 16-19
In Labor Force | Age 16-19 Comparison
Hispanics or Latinos
Canadians
34.5%
IN LABOR FORCE | AGE 16-19
1.1/ 100
METRIC RATING
262nd/ 347
METRIC RANK
40.1%
IN LABOR FORCE | AGE 16-19
100.0/ 100
METRIC RATING
67th/ 347
METRIC RANK
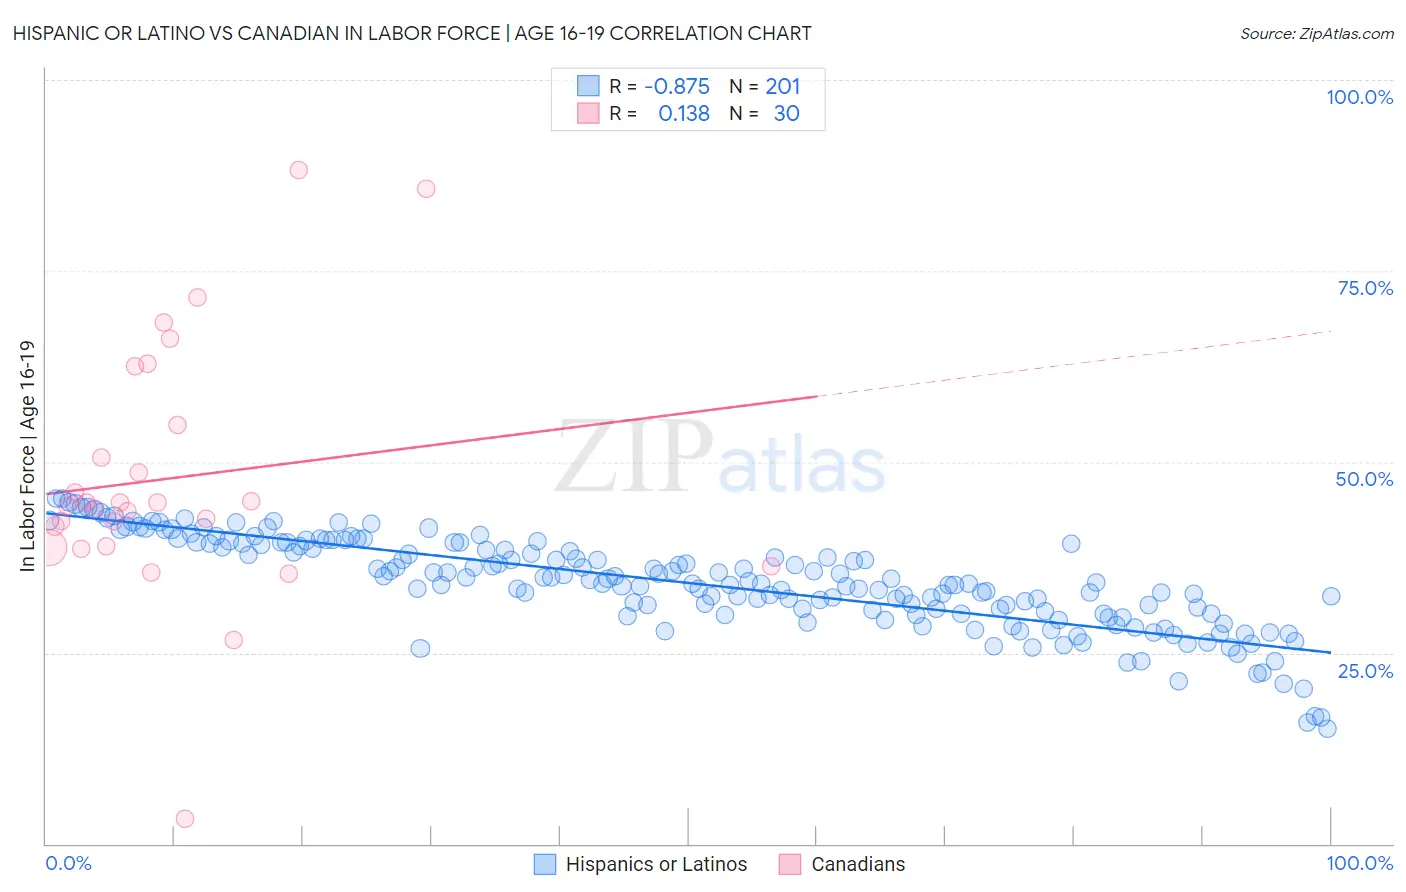
Hispanic or Latino vs Canadian In Labor Force | Age 16-19 Correlation Chart
The statistical analysis conducted on geographies consisting of 573,733,594 people shows a very strong negative correlation between the proportion of Hispanics or Latinos and labor force participation rate among population between the ages 16 and 19 in the United States with a correlation coefficient (R) of -0.875 and weighted average of 34.5%. Similarly, the statistical analysis conducted on geographies consisting of 436,563,556 people shows a poor positive correlation between the proportion of Canadians and labor force participation rate among population between the ages 16 and 19 in the United States with a correlation coefficient (R) of 0.138 and weighted average of 40.1%, a difference of 16.2%.
In Labor Force | Age 16-19 Correlation Summary
| Measurement | Hispanic or Latino | Canadian |
| Minimum | 15.0% | 3.2% |
| Maximum | 45.2% | 88.2% |
| Range | 30.2% | 85.0% |
| Mean | 34.1% | 47.9% |
| Median | 34.3% | 44.4% |
| Interquartile 25% (IQ1) | 30.2% | 39.0% |
| Interquartile 75% (IQ3) | 39.3% | 54.8% |
| Interquartile Range (IQR) | 9.1% | 15.8% |
| Standard Deviation (Sample) | 6.1% | 16.8% |
| Standard Deviation (Population) | 6.1% | 16.6% |
Similar Demographics by In Labor Force | Age 16-19
Demographics Similar to Hispanics or Latinos by In Labor Force | Age 16-19
In terms of in labor force | age 16-19, the demographic groups most similar to Hispanics or Latinos are Salvadoran (34.5%, a difference of 0.010%), Burmese (34.5%, a difference of 0.040%), Egyptian (34.5%, a difference of 0.050%), Immigrants (34.6%, a difference of 0.13%), and Immigrants from Egypt (34.6%, a difference of 0.15%).
| Demographics | Rating | Rank | In Labor Force | Age 16-19 |
| Peruvians | 1.4 /100 | #255 | Tragic 34.6% |
| Immigrants | South Central Asia | 1.3 /100 | #256 | Tragic 34.6% |
| Immigrants | Egypt | 1.2 /100 | #257 | Tragic 34.6% |
| Thais | 1.2 /100 | #258 | Tragic 34.6% |
| Immigrants | Immigrants | 1.2 /100 | #259 | Tragic 34.6% |
| Egyptians | 1.2 /100 | #260 | Tragic 34.5% |
| Salvadorans | 1.1 /100 | #261 | Tragic 34.5% |
| Hispanics or Latinos | 1.1 /100 | #262 | Tragic 34.5% |
| Burmese | 1.1 /100 | #263 | Tragic 34.5% |
| Immigrants | Uruguay | 0.9 /100 | #264 | Tragic 34.4% |
| Immigrants | El Salvador | 0.7 /100 | #265 | Tragic 34.3% |
| Immigrants | Malaysia | 0.7 /100 | #266 | Tragic 34.3% |
| Immigrants | Peru | 0.5 /100 | #267 | Tragic 34.2% |
| Immigrants | Asia | 0.5 /100 | #268 | Tragic 34.1% |
| Pima | 0.5 /100 | #269 | Tragic 34.1% |
Demographics Similar to Canadians by In Labor Force | Age 16-19
In terms of in labor force | age 16-19, the demographic groups most similar to Canadians are Nonimmigrants (40.1%, a difference of 0.010%), Italian (40.1%, a difference of 0.060%), Kenyan (40.1%, a difference of 0.13%), Potawatomi (40.0%, a difference of 0.13%), and Portuguese (40.0%, a difference of 0.18%).
| Demographics | Rating | Rank | In Labor Force | Age 16-19 |
| Immigrants | Eastern Africa | 100.0 /100 | #60 | Exceptional 40.4% |
| Americans | 100.0 /100 | #61 | Exceptional 40.3% |
| Cherokee | 100.0 /100 | #62 | Exceptional 40.2% |
| Northern Europeans | 100.0 /100 | #63 | Exceptional 40.2% |
| Immigrants | Micronesia | 100.0 /100 | #64 | Exceptional 40.2% |
| Kenyans | 100.0 /100 | #65 | Exceptional 40.1% |
| Immigrants | Nonimmigrants | 100.0 /100 | #66 | Exceptional 40.1% |
| Canadians | 100.0 /100 | #67 | Exceptional 40.1% |
| Italians | 99.9 /100 | #68 | Exceptional 40.1% |
| Potawatomi | 99.9 /100 | #69 | Exceptional 40.0% |
| Portuguese | 99.9 /100 | #70 | Exceptional 40.0% |
| Serbians | 99.9 /100 | #71 | Exceptional 39.9% |
| Iroquois | 99.9 /100 | #72 | Exceptional 39.9% |
| Immigrants | Middle Africa | 99.9 /100 | #73 | Exceptional 39.9% |
| Hungarians | 99.9 /100 | #74 | Exceptional 39.8% |