Hawaiian vs Mexican In Labor Force | Age 30-34
COMPARE
Hawaiian
Mexican
In Labor Force | Age 30-34
In Labor Force | Age 30-34 Comparison
Hawaiians
Mexicans
83.0%
IN LABOR FORCE | AGE 30-34
0.0/ 100
METRIC RATING
289th/ 347
METRIC RANK
81.9%
IN LABOR FORCE | AGE 30-34
0.0/ 100
METRIC RATING
312th/ 347
METRIC RANK
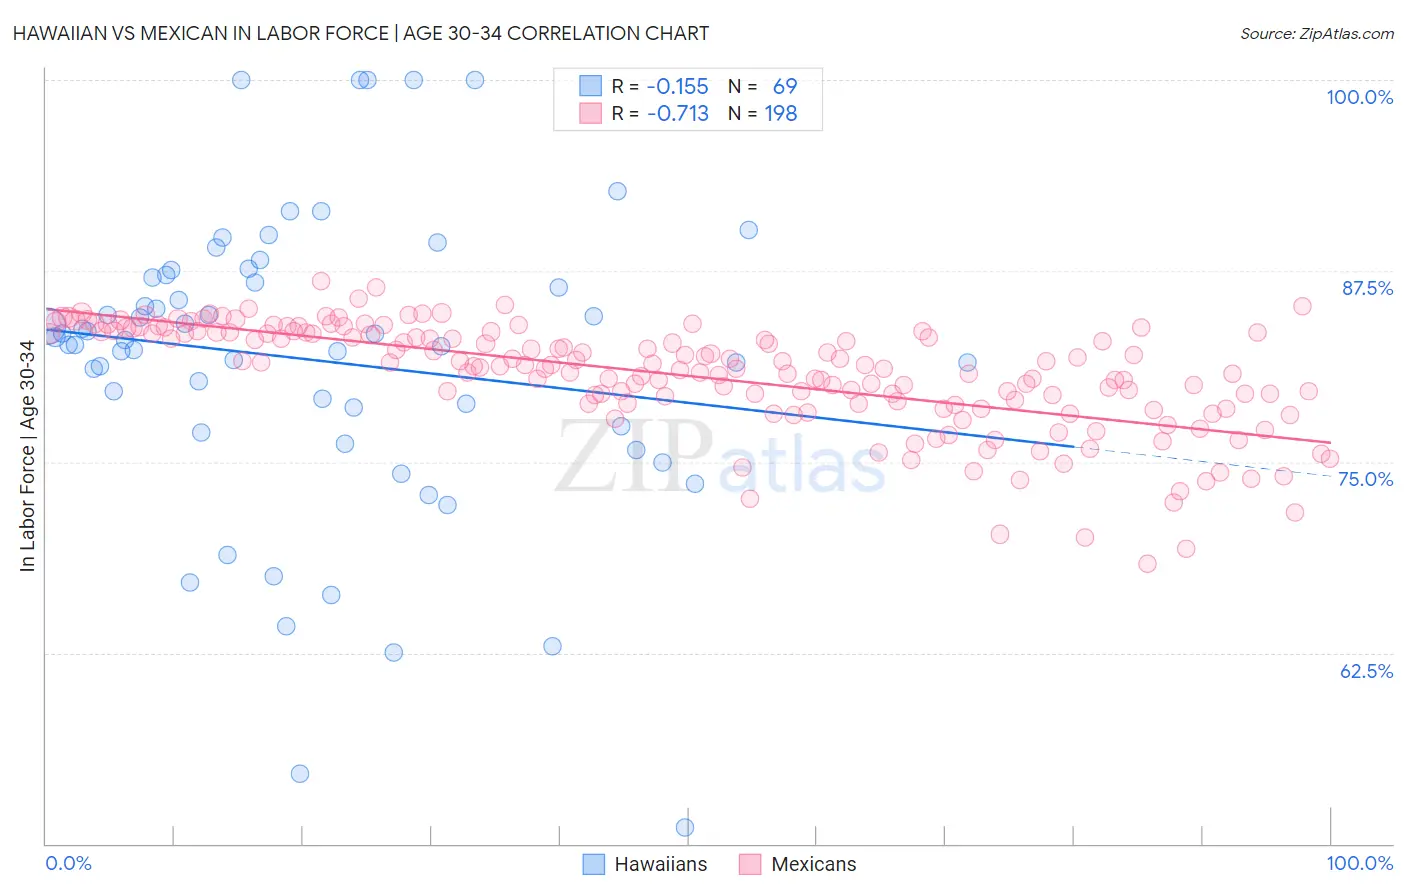
Hawaiian vs Mexican In Labor Force | Age 30-34 Correlation Chart
The statistical analysis conducted on geographies consisting of 327,455,598 people shows a poor negative correlation between the proportion of Hawaiians and labor force participation rate among population between the ages 30 and 34 in the United States with a correlation coefficient (R) of -0.155 and weighted average of 83.0%. Similarly, the statistical analysis conducted on geographies consisting of 564,037,152 people shows a strong negative correlation between the proportion of Mexicans and labor force participation rate among population between the ages 30 and 34 in the United States with a correlation coefficient (R) of -0.713 and weighted average of 81.9%, a difference of 1.3%.
In Labor Force | Age 30-34 Correlation Summary
| Measurement | Hawaiian | Mexican |
| Minimum | 51.1% | 68.3% |
| Maximum | 100.0% | 86.8% |
| Range | 48.9% | 18.5% |
| Mean | 81.7% | 80.7% |
| Median | 83.0% | 81.3% |
| Interquartile 25% (IQ1) | 77.2% | 78.8% |
| Interquartile 75% (IQ3) | 87.1% | 83.5% |
| Interquartile Range (IQR) | 10.0% | 4.6% |
| Standard Deviation (Sample) | 9.9% | 3.5% |
| Standard Deviation (Population) | 9.8% | 3.5% |
Similar Demographics by In Labor Force | Age 30-34
Demographics Similar to Hawaiians by In Labor Force | Age 30-34
In terms of in labor force | age 30-34, the demographic groups most similar to Hawaiians are Central American Indian (83.0%, a difference of 0.020%), Native Hawaiian (83.0%, a difference of 0.050%), Immigrants from Latin America (83.1%, a difference of 0.15%), Immigrants from Belize (83.2%, a difference of 0.21%), and Cree (83.2%, a difference of 0.21%).
| Demographics | Rating | Rank | In Labor Force | Age 30-34 |
| Mexican American Indians | 0.0 /100 | #282 | Tragic 83.2% |
| Assyrians/Chaldeans/Syriacs | 0.0 /100 | #283 | Tragic 83.2% |
| Immigrants | Belize | 0.0 /100 | #284 | Tragic 83.2% |
| Cree | 0.0 /100 | #285 | Tragic 83.2% |
| Immigrants | Latin America | 0.0 /100 | #286 | Tragic 83.1% |
| Native Hawaiians | 0.0 /100 | #287 | Tragic 83.0% |
| Central American Indians | 0.0 /100 | #288 | Tragic 83.0% |
| Hawaiians | 0.0 /100 | #289 | Tragic 83.0% |
| Blackfeet | 0.0 /100 | #290 | Tragic 82.8% |
| Potawatomi | 0.0 /100 | #291 | Tragic 82.8% |
| Blacks/African Americans | 0.0 /100 | #292 | Tragic 82.8% |
| Nepalese | 0.0 /100 | #293 | Tragic 82.7% |
| Americans | 0.0 /100 | #294 | Tragic 82.7% |
| Pennsylvania Germans | 0.0 /100 | #295 | Tragic 82.6% |
| Chippewa | 0.0 /100 | #296 | Tragic 82.6% |
Demographics Similar to Mexicans by In Labor Force | Age 30-34
In terms of in labor force | age 30-34, the demographic groups most similar to Mexicans are Chickasaw (81.9%, a difference of 0.0%), Iroquois (81.9%, a difference of 0.020%), Cajun (82.0%, a difference of 0.050%), Immigrants from Mexico (82.0%, a difference of 0.070%), and Puget Sound Salish (82.1%, a difference of 0.24%).
| Demographics | Rating | Rank | In Labor Force | Age 30-34 |
| Osage | 0.0 /100 | #305 | Tragic 82.3% |
| Spanish American Indians | 0.0 /100 | #306 | Tragic 82.2% |
| Menominee | 0.0 /100 | #307 | Tragic 82.2% |
| Puget Sound Salish | 0.0 /100 | #308 | Tragic 82.1% |
| Immigrants | Mexico | 0.0 /100 | #309 | Tragic 82.0% |
| Cajuns | 0.0 /100 | #310 | Tragic 82.0% |
| Chickasaw | 0.0 /100 | #311 | Tragic 81.9% |
| Mexicans | 0.0 /100 | #312 | Tragic 81.9% |
| Iroquois | 0.0 /100 | #313 | Tragic 81.9% |
| Alaskan Athabascans | 0.0 /100 | #314 | Tragic 81.7% |
| Cherokee | 0.0 /100 | #315 | Tragic 81.6% |
| Immigrants | Azores | 0.0 /100 | #316 | Tragic 81.5% |
| Arapaho | 0.0 /100 | #317 | Tragic 81.5% |
| Choctaw | 0.0 /100 | #318 | Tragic 81.4% |
| Shoshone | 0.0 /100 | #319 | Tragic 81.4% |