Hawaiian vs Spanish American In Labor Force | Age 30-34
COMPARE
Hawaiian
Spanish American
In Labor Force | Age 30-34
In Labor Force | Age 30-34 Comparison
Hawaiians
Spanish Americans
83.0%
IN LABOR FORCE | AGE 30-34
0.0/ 100
METRIC RATING
289th/ 347
METRIC RANK
83.5%
IN LABOR FORCE | AGE 30-34
0.0/ 100
METRIC RATING
270th/ 347
METRIC RANK
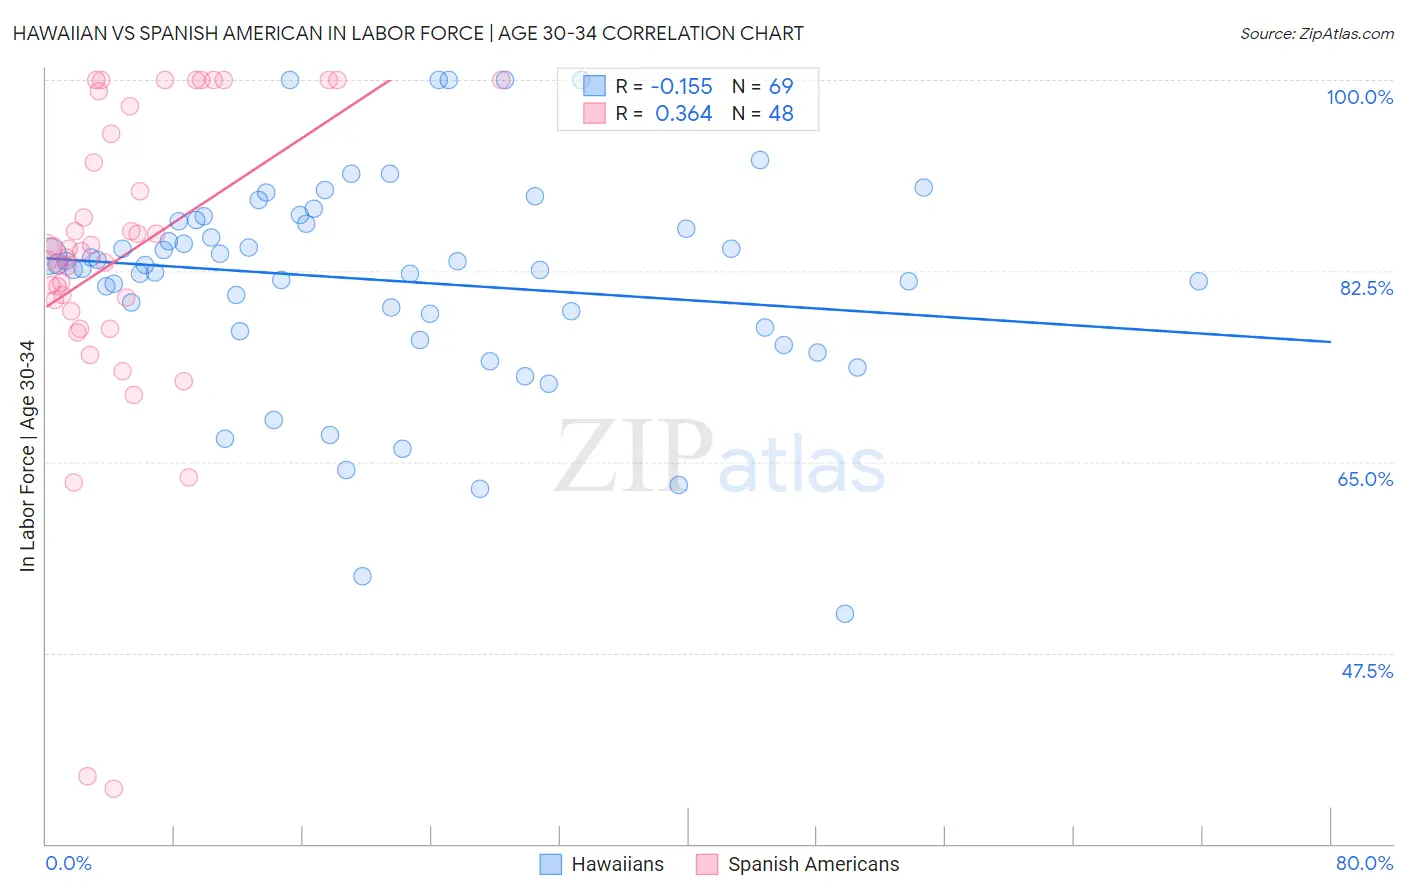
Hawaiian vs Spanish American In Labor Force | Age 30-34 Correlation Chart
The statistical analysis conducted on geographies consisting of 327,455,598 people shows a poor negative correlation between the proportion of Hawaiians and labor force participation rate among population between the ages 30 and 34 in the United States with a correlation coefficient (R) of -0.155 and weighted average of 83.0%. Similarly, the statistical analysis conducted on geographies consisting of 103,148,754 people shows a mild positive correlation between the proportion of Spanish Americans and labor force participation rate among population between the ages 30 and 34 in the United States with a correlation coefficient (R) of 0.364 and weighted average of 83.5%, a difference of 0.67%.
In Labor Force | Age 30-34 Correlation Summary
| Measurement | Hawaiian | Spanish American |
| Minimum | 51.1% | 35.0% |
| Maximum | 100.0% | 100.0% |
| Range | 48.9% | 65.0% |
| Mean | 81.7% | 83.9% |
| Median | 83.0% | 84.4% |
| Interquartile 25% (IQ1) | 77.2% | 79.3% |
| Interquartile 75% (IQ3) | 87.1% | 96.3% |
| Interquartile Range (IQR) | 10.0% | 17.1% |
| Standard Deviation (Sample) | 9.9% | 14.2% |
| Standard Deviation (Population) | 9.8% | 14.1% |
Demographics Similar to Hawaiians and Spanish Americans by In Labor Force | Age 30-34
In terms of in labor force | age 30-34, the demographic groups most similar to Hawaiians are Central American Indian (83.0%, a difference of 0.020%), Native Hawaiian (83.0%, a difference of 0.050%), Immigrants from Latin America (83.1%, a difference of 0.15%), Immigrants from Belize (83.2%, a difference of 0.21%), and Cree (83.2%, a difference of 0.21%). Similarly, the demographic groups most similar to Spanish Americans are Spanish (83.5%, a difference of 0.020%), Nonimmigrants (83.5%, a difference of 0.020%), Vietnamese (83.6%, a difference of 0.050%), Guamanian/Chamorro (83.5%, a difference of 0.070%), and Belizean (83.5%, a difference of 0.080%).
| Demographics | Rating | Rank | In Labor Force | Age 30-34 |
| Vietnamese | 0.1 /100 | #269 | Tragic 83.6% |
| Spanish Americans | 0.0 /100 | #270 | Tragic 83.5% |
| Spanish | 0.0 /100 | #271 | Tragic 83.5% |
| Immigrants | Nonimmigrants | 0.0 /100 | #272 | Tragic 83.5% |
| Guamanians/Chamorros | 0.0 /100 | #273 | Tragic 83.5% |
| Belizeans | 0.0 /100 | #274 | Tragic 83.5% |
| Immigrants | Grenada | 0.0 /100 | #275 | Tragic 83.5% |
| Tongans | 0.0 /100 | #276 | Tragic 83.5% |
| Delaware | 0.0 /100 | #277 | Tragic 83.5% |
| Fijians | 0.0 /100 | #278 | Tragic 83.4% |
| Immigrants | Fiji | 0.0 /100 | #279 | Tragic 83.4% |
| Africans | 0.0 /100 | #280 | Tragic 83.4% |
| Samoans | 0.0 /100 | #281 | Tragic 83.3% |
| Mexican American Indians | 0.0 /100 | #282 | Tragic 83.2% |
| Assyrians/Chaldeans/Syriacs | 0.0 /100 | #283 | Tragic 83.2% |
| Immigrants | Belize | 0.0 /100 | #284 | Tragic 83.2% |
| Cree | 0.0 /100 | #285 | Tragic 83.2% |
| Immigrants | Latin America | 0.0 /100 | #286 | Tragic 83.1% |
| Native Hawaiians | 0.0 /100 | #287 | Tragic 83.0% |
| Central American Indians | 0.0 /100 | #288 | Tragic 83.0% |
| Hawaiians | 0.0 /100 | #289 | Tragic 83.0% |