Hawaiian vs Lebanese In Labor Force | Age 30-34
COMPARE
Hawaiian
Lebanese
In Labor Force | Age 30-34
In Labor Force | Age 30-34 Comparison
Hawaiians
Lebanese
83.0%
IN LABOR FORCE | AGE 30-34
0.0/ 100
METRIC RATING
289th/ 347
METRIC RANK
84.4%
IN LABOR FORCE | AGE 30-34
10.6/ 100
METRIC RATING
206th/ 347
METRIC RANK
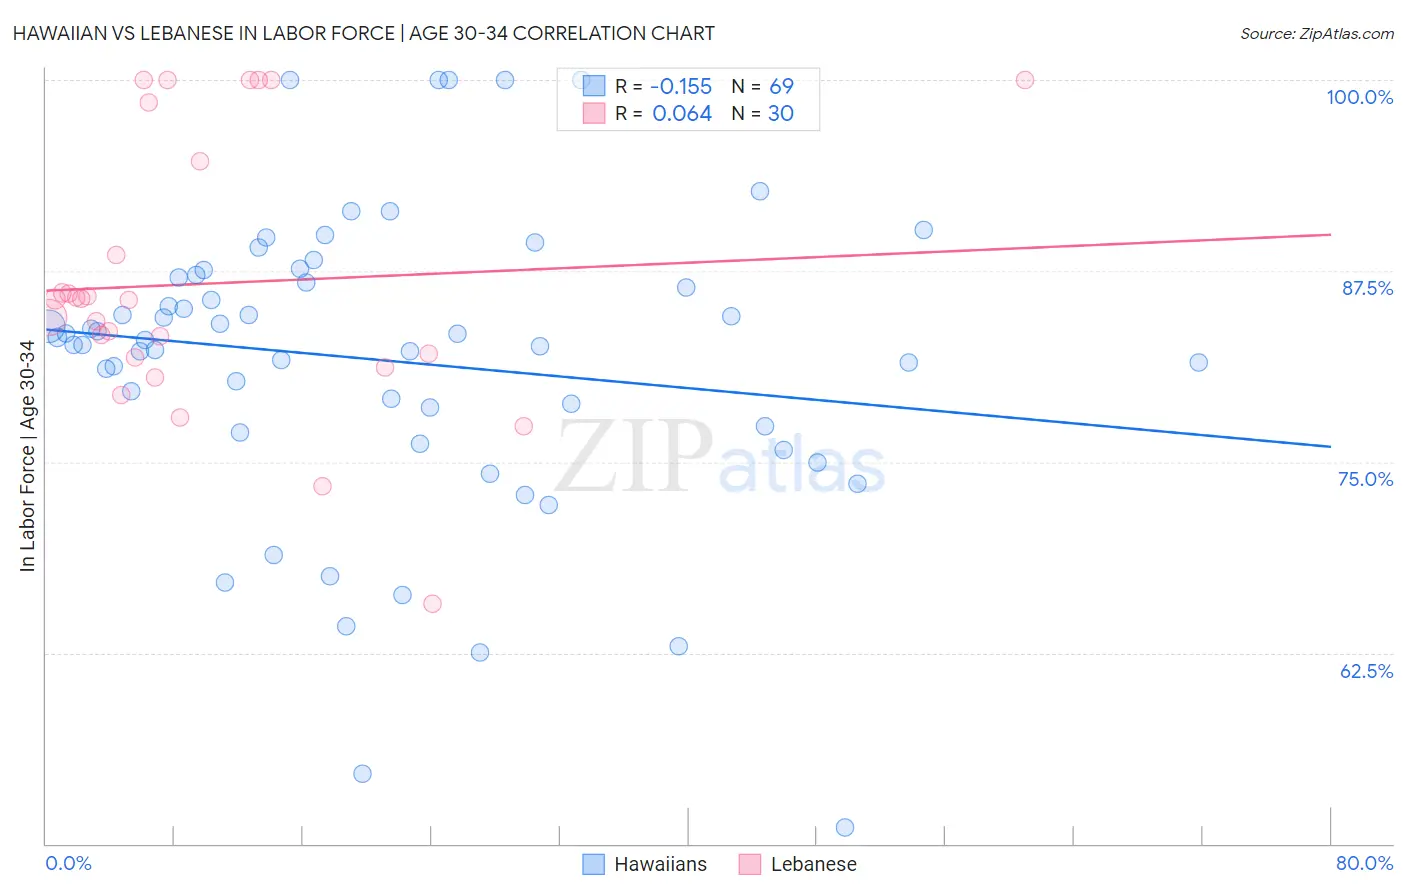
Hawaiian vs Lebanese In Labor Force | Age 30-34 Correlation Chart
The statistical analysis conducted on geographies consisting of 327,455,598 people shows a poor negative correlation between the proportion of Hawaiians and labor force participation rate among population between the ages 30 and 34 in the United States with a correlation coefficient (R) of -0.155 and weighted average of 83.0%. Similarly, the statistical analysis conducted on geographies consisting of 401,295,457 people shows a slight positive correlation between the proportion of Lebanese and labor force participation rate among population between the ages 30 and 34 in the United States with a correlation coefficient (R) of 0.064 and weighted average of 84.4%, a difference of 1.7%.
In Labor Force | Age 30-34 Correlation Summary
| Measurement | Hawaiian | Lebanese |
| Minimum | 51.1% | 65.7% |
| Maximum | 100.0% | 100.0% |
| Range | 48.9% | 34.3% |
| Mean | 81.7% | 86.7% |
| Median | 83.0% | 85.6% |
| Interquartile 25% (IQ1) | 77.2% | 81.8% |
| Interquartile 75% (IQ3) | 87.1% | 94.7% |
| Interquartile Range (IQR) | 10.0% | 12.9% |
| Standard Deviation (Sample) | 9.9% | 8.8% |
| Standard Deviation (Population) | 9.8% | 8.7% |
Similar Demographics by In Labor Force | Age 30-34
Demographics Similar to Hawaiians by In Labor Force | Age 30-34
In terms of in labor force | age 30-34, the demographic groups most similar to Hawaiians are Central American Indian (83.0%, a difference of 0.020%), Native Hawaiian (83.0%, a difference of 0.050%), Immigrants from Latin America (83.1%, a difference of 0.15%), Immigrants from Belize (83.2%, a difference of 0.21%), and Cree (83.2%, a difference of 0.21%).
| Demographics | Rating | Rank | In Labor Force | Age 30-34 |
| Mexican American Indians | 0.0 /100 | #282 | Tragic 83.2% |
| Assyrians/Chaldeans/Syriacs | 0.0 /100 | #283 | Tragic 83.2% |
| Immigrants | Belize | 0.0 /100 | #284 | Tragic 83.2% |
| Cree | 0.0 /100 | #285 | Tragic 83.2% |
| Immigrants | Latin America | 0.0 /100 | #286 | Tragic 83.1% |
| Native Hawaiians | 0.0 /100 | #287 | Tragic 83.0% |
| Central American Indians | 0.0 /100 | #288 | Tragic 83.0% |
| Hawaiians | 0.0 /100 | #289 | Tragic 83.0% |
| Blackfeet | 0.0 /100 | #290 | Tragic 82.8% |
| Potawatomi | 0.0 /100 | #291 | Tragic 82.8% |
| Blacks/African Americans | 0.0 /100 | #292 | Tragic 82.8% |
| Nepalese | 0.0 /100 | #293 | Tragic 82.7% |
| Americans | 0.0 /100 | #294 | Tragic 82.7% |
| Pennsylvania Germans | 0.0 /100 | #295 | Tragic 82.6% |
| Chippewa | 0.0 /100 | #296 | Tragic 82.6% |
Demographics Similar to Lebanese by In Labor Force | Age 30-34
In terms of in labor force | age 30-34, the demographic groups most similar to Lebanese are Bangladeshi (84.3%, a difference of 0.020%), Arab (84.3%, a difference of 0.030%), Jamaican (84.3%, a difference of 0.040%), Indonesian (84.3%, a difference of 0.040%), and Japanese (84.3%, a difference of 0.040%).
| Demographics | Rating | Rank | In Labor Force | Age 30-34 |
| Immigrants | Thailand | 19.1 /100 | #199 | Poor 84.5% |
| Sub-Saharan Africans | 19.0 /100 | #200 | Poor 84.5% |
| Trinidadians and Tobagonians | 18.2 /100 | #201 | Poor 84.5% |
| Immigrants | West Indies | 18.1 /100 | #202 | Poor 84.5% |
| Canadians | 15.4 /100 | #203 | Poor 84.4% |
| Ecuadorians | 14.2 /100 | #204 | Poor 84.4% |
| French | 13.8 /100 | #205 | Poor 84.4% |
| Lebanese | 10.6 /100 | #206 | Poor 84.4% |
| Bangladeshis | 9.4 /100 | #207 | Tragic 84.3% |
| Arabs | 8.9 /100 | #208 | Tragic 84.3% |
| Jamaicans | 8.8 /100 | #209 | Tragic 84.3% |
| Indonesians | 8.8 /100 | #210 | Tragic 84.3% |
| Japanese | 8.8 /100 | #211 | Tragic 84.3% |
| Immigrants | Western Asia | 8.2 /100 | #212 | Tragic 84.3% |
| Immigrants | Jamaica | 7.9 /100 | #213 | Tragic 84.3% |