Turkish vs Mexican In Labor Force | Age 30-34
COMPARE
Turkish
Mexican
In Labor Force | Age 30-34
In Labor Force | Age 30-34 Comparison
Turks
Mexicans
85.7%
IN LABOR FORCE | AGE 30-34
99.9/ 100
METRIC RATING
40th/ 347
METRIC RANK
81.9%
IN LABOR FORCE | AGE 30-34
0.0/ 100
METRIC RATING
312th/ 347
METRIC RANK
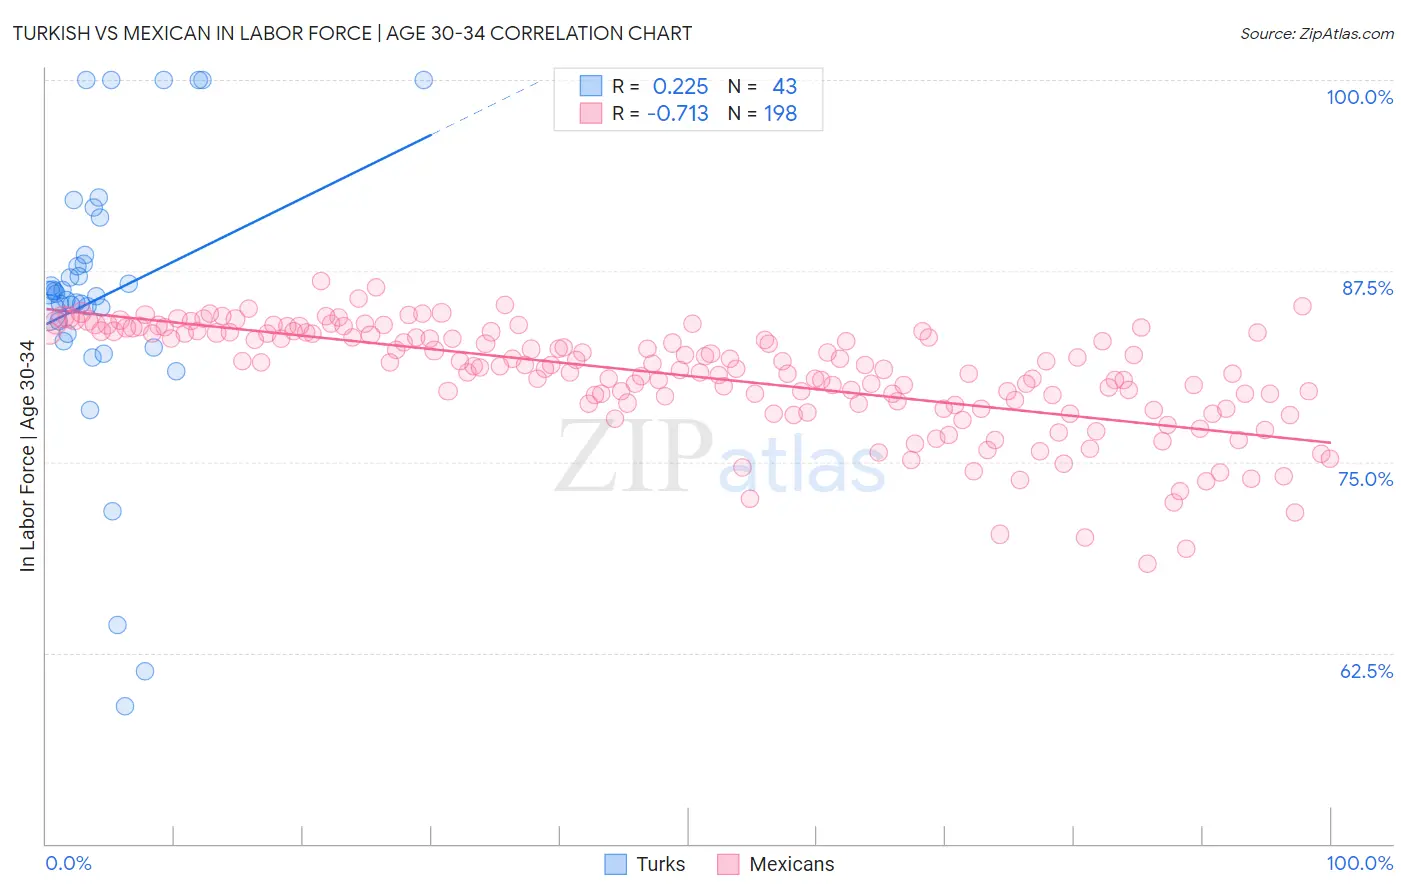
Turkish vs Mexican In Labor Force | Age 30-34 Correlation Chart
The statistical analysis conducted on geographies consisting of 271,716,340 people shows a weak positive correlation between the proportion of Turks and labor force participation rate among population between the ages 30 and 34 in the United States with a correlation coefficient (R) of 0.225 and weighted average of 85.7%. Similarly, the statistical analysis conducted on geographies consisting of 564,037,152 people shows a strong negative correlation between the proportion of Mexicans and labor force participation rate among population between the ages 30 and 34 in the United States with a correlation coefficient (R) of -0.713 and weighted average of 81.9%, a difference of 4.6%.
In Labor Force | Age 30-34 Correlation Summary
| Measurement | Turkish | Mexican |
| Minimum | 59.0% | 68.3% |
| Maximum | 100.0% | 86.8% |
| Range | 41.0% | 18.5% |
| Mean | 85.8% | 80.7% |
| Median | 86.0% | 81.3% |
| Interquartile 25% (IQ1) | 83.4% | 78.8% |
| Interquartile 75% (IQ3) | 88.6% | 83.5% |
| Interquartile Range (IQR) | 5.1% | 4.6% |
| Standard Deviation (Sample) | 9.1% | 3.5% |
| Standard Deviation (Population) | 9.0% | 3.5% |
Similar Demographics by In Labor Force | Age 30-34
Demographics Similar to Turks by In Labor Force | Age 30-34
In terms of in labor force | age 30-34, the demographic groups most similar to Turks are Immigrants from Italy (85.7%, a difference of 0.030%), Zimbabwean (85.6%, a difference of 0.030%), Eastern European (85.7%, a difference of 0.040%), Immigrants from Lithuania (85.6%, a difference of 0.040%), and Immigrants from Sri Lanka (85.6%, a difference of 0.060%).
| Demographics | Rating | Rank | In Labor Force | Age 30-34 |
| Immigrants | Bosnia and Herzegovina | 99.9 /100 | #33 | Exceptional 85.8% |
| Ugandans | 99.9 /100 | #34 | Exceptional 85.8% |
| Serbians | 99.9 /100 | #35 | Exceptional 85.8% |
| Albanians | 99.9 /100 | #36 | Exceptional 85.7% |
| Norwegians | 99.9 /100 | #37 | Exceptional 85.7% |
| Immigrants | Greece | 99.9 /100 | #38 | Exceptional 85.7% |
| Eastern Europeans | 99.9 /100 | #39 | Exceptional 85.7% |
| Turks | 99.9 /100 | #40 | Exceptional 85.7% |
| Immigrants | Italy | 99.9 /100 | #41 | Exceptional 85.7% |
| Zimbabweans | 99.8 /100 | #42 | Exceptional 85.6% |
| Immigrants | Lithuania | 99.8 /100 | #43 | Exceptional 85.6% |
| Immigrants | Sri Lanka | 99.8 /100 | #44 | Exceptional 85.6% |
| Immigrants | Nepal | 99.8 /100 | #45 | Exceptional 85.6% |
| Immigrants | Morocco | 99.8 /100 | #46 | Exceptional 85.6% |
| Croatians | 99.8 /100 | #47 | Exceptional 85.6% |
Demographics Similar to Mexicans by In Labor Force | Age 30-34
In terms of in labor force | age 30-34, the demographic groups most similar to Mexicans are Chickasaw (81.9%, a difference of 0.0%), Iroquois (81.9%, a difference of 0.020%), Cajun (82.0%, a difference of 0.050%), Immigrants from Mexico (82.0%, a difference of 0.070%), and Puget Sound Salish (82.1%, a difference of 0.24%).
| Demographics | Rating | Rank | In Labor Force | Age 30-34 |
| Osage | 0.0 /100 | #305 | Tragic 82.3% |
| Spanish American Indians | 0.0 /100 | #306 | Tragic 82.2% |
| Menominee | 0.0 /100 | #307 | Tragic 82.2% |
| Puget Sound Salish | 0.0 /100 | #308 | Tragic 82.1% |
| Immigrants | Mexico | 0.0 /100 | #309 | Tragic 82.0% |
| Cajuns | 0.0 /100 | #310 | Tragic 82.0% |
| Chickasaw | 0.0 /100 | #311 | Tragic 81.9% |
| Mexicans | 0.0 /100 | #312 | Tragic 81.9% |
| Iroquois | 0.0 /100 | #313 | Tragic 81.9% |
| Alaskan Athabascans | 0.0 /100 | #314 | Tragic 81.7% |
| Cherokee | 0.0 /100 | #315 | Tragic 81.6% |
| Immigrants | Azores | 0.0 /100 | #316 | Tragic 81.5% |
| Arapaho | 0.0 /100 | #317 | Tragic 81.5% |
| Choctaw | 0.0 /100 | #318 | Tragic 81.4% |
| Shoshone | 0.0 /100 | #319 | Tragic 81.4% |