Bahamian vs Mexican In Labor Force | Age 30-34
COMPARE
Bahamian
Mexican
In Labor Force | Age 30-34
In Labor Force | Age 30-34 Comparison
Bahamians
Mexicans
83.9%
IN LABOR FORCE | AGE 30-34
0.6/ 100
METRIC RATING
252nd/ 347
METRIC RANK
81.9%
IN LABOR FORCE | AGE 30-34
0.0/ 100
METRIC RATING
312th/ 347
METRIC RANK
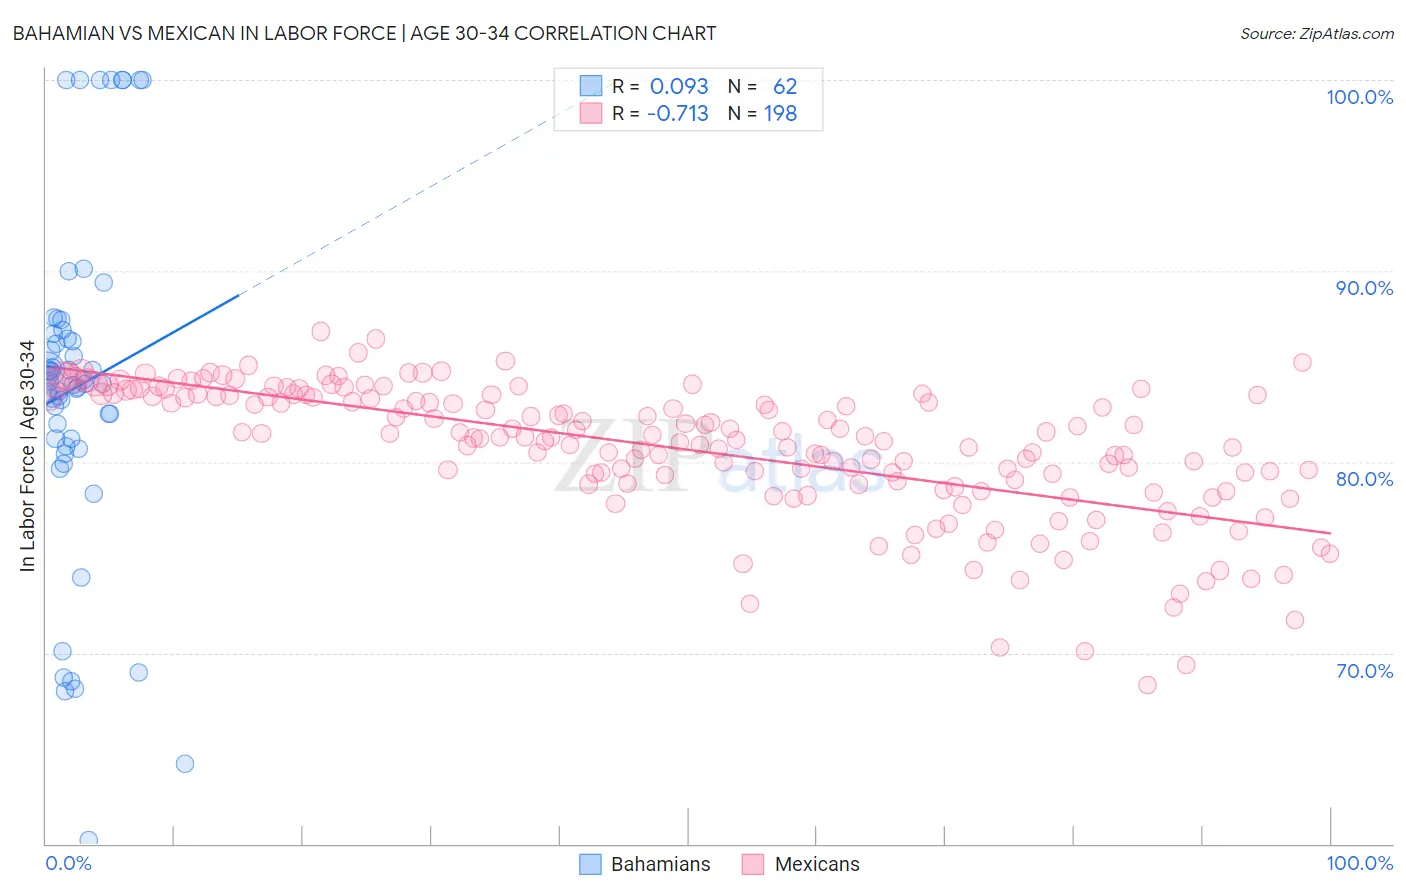
Bahamian vs Mexican In Labor Force | Age 30-34 Correlation Chart
The statistical analysis conducted on geographies consisting of 112,639,396 people shows a slight positive correlation between the proportion of Bahamians and labor force participation rate among population between the ages 30 and 34 in the United States with a correlation coefficient (R) of 0.093 and weighted average of 83.9%. Similarly, the statistical analysis conducted on geographies consisting of 564,037,152 people shows a strong negative correlation between the proportion of Mexicans and labor force participation rate among population between the ages 30 and 34 in the United States with a correlation coefficient (R) of -0.713 and weighted average of 81.9%, a difference of 2.5%.
In Labor Force | Age 30-34 Correlation Summary
| Measurement | Bahamian | Mexican |
| Minimum | 60.2% | 68.3% |
| Maximum | 100.0% | 86.8% |
| Range | 39.8% | 18.5% |
| Mean | 83.9% | 80.7% |
| Median | 84.2% | 81.3% |
| Interquartile 25% (IQ1) | 81.2% | 78.8% |
| Interquartile 75% (IQ3) | 86.7% | 83.5% |
| Interquartile Range (IQR) | 5.5% | 4.6% |
| Standard Deviation (Sample) | 8.9% | 3.5% |
| Standard Deviation (Population) | 8.8% | 3.5% |
Similar Demographics by In Labor Force | Age 30-34
Demographics Similar to Bahamians by In Labor Force | Age 30-34
In terms of in labor force | age 30-34, the demographic groups most similar to Bahamians are Nicaraguan (83.9%, a difference of 0.0%), Immigrants from Nicaragua (83.9%, a difference of 0.0%), Immigrants from Iraq (83.9%, a difference of 0.020%), Immigrants from St. Vincent and the Grenadines (83.9%, a difference of 0.020%), and Portuguese (84.0%, a difference of 0.040%).
| Demographics | Rating | Rank | In Labor Force | Age 30-34 |
| Immigrants | Venezuela | 0.9 /100 | #245 | Tragic 84.0% |
| Central Americans | 0.9 /100 | #246 | Tragic 84.0% |
| British West Indians | 0.8 /100 | #247 | Tragic 84.0% |
| Portuguese | 0.8 /100 | #248 | Tragic 84.0% |
| Immigrants | Dominica | 0.7 /100 | #249 | Tragic 84.0% |
| Immigrants | Iraq | 0.7 /100 | #250 | Tragic 83.9% |
| Nicaraguans | 0.6 /100 | #251 | Tragic 83.9% |
| Bahamians | 0.6 /100 | #252 | Tragic 83.9% |
| Immigrants | Nicaragua | 0.6 /100 | #253 | Tragic 83.9% |
| Immigrants | St. Vincent and the Grenadines | 0.5 /100 | #254 | Tragic 83.9% |
| Whites/Caucasians | 0.5 /100 | #255 | Tragic 83.9% |
| Immigrants | Lebanon | 0.4 /100 | #256 | Tragic 83.9% |
| Iraqis | 0.3 /100 | #257 | Tragic 83.8% |
| Hondurans | 0.3 /100 | #258 | Tragic 83.8% |
| Scotch-Irish | 0.3 /100 | #259 | Tragic 83.8% |
Demographics Similar to Mexicans by In Labor Force | Age 30-34
In terms of in labor force | age 30-34, the demographic groups most similar to Mexicans are Chickasaw (81.9%, a difference of 0.0%), Iroquois (81.9%, a difference of 0.020%), Cajun (82.0%, a difference of 0.050%), Immigrants from Mexico (82.0%, a difference of 0.070%), and Puget Sound Salish (82.1%, a difference of 0.24%).
| Demographics | Rating | Rank | In Labor Force | Age 30-34 |
| Osage | 0.0 /100 | #305 | Tragic 82.3% |
| Spanish American Indians | 0.0 /100 | #306 | Tragic 82.2% |
| Menominee | 0.0 /100 | #307 | Tragic 82.2% |
| Puget Sound Salish | 0.0 /100 | #308 | Tragic 82.1% |
| Immigrants | Mexico | 0.0 /100 | #309 | Tragic 82.0% |
| Cajuns | 0.0 /100 | #310 | Tragic 82.0% |
| Chickasaw | 0.0 /100 | #311 | Tragic 81.9% |
| Mexicans | 0.0 /100 | #312 | Tragic 81.9% |
| Iroquois | 0.0 /100 | #313 | Tragic 81.9% |
| Alaskan Athabascans | 0.0 /100 | #314 | Tragic 81.7% |
| Cherokee | 0.0 /100 | #315 | Tragic 81.6% |
| Immigrants | Azores | 0.0 /100 | #316 | Tragic 81.5% |
| Arapaho | 0.0 /100 | #317 | Tragic 81.5% |
| Choctaw | 0.0 /100 | #318 | Tragic 81.4% |
| Shoshone | 0.0 /100 | #319 | Tragic 81.4% |