Immigrants from Congo vs Polish In Labor Force | Age 30-34
COMPARE
Immigrants from Congo
Polish
In Labor Force | Age 30-34
In Labor Force | Age 30-34 Comparison
Immigrants from Congo
Poles
84.6%
IN LABOR FORCE | AGE 30-34
29.7/ 100
METRIC RATING
186th/ 347
METRIC RANK
85.5%
IN LABOR FORCE | AGE 30-34
99.6/ 100
METRIC RATING
58th/ 347
METRIC RANK
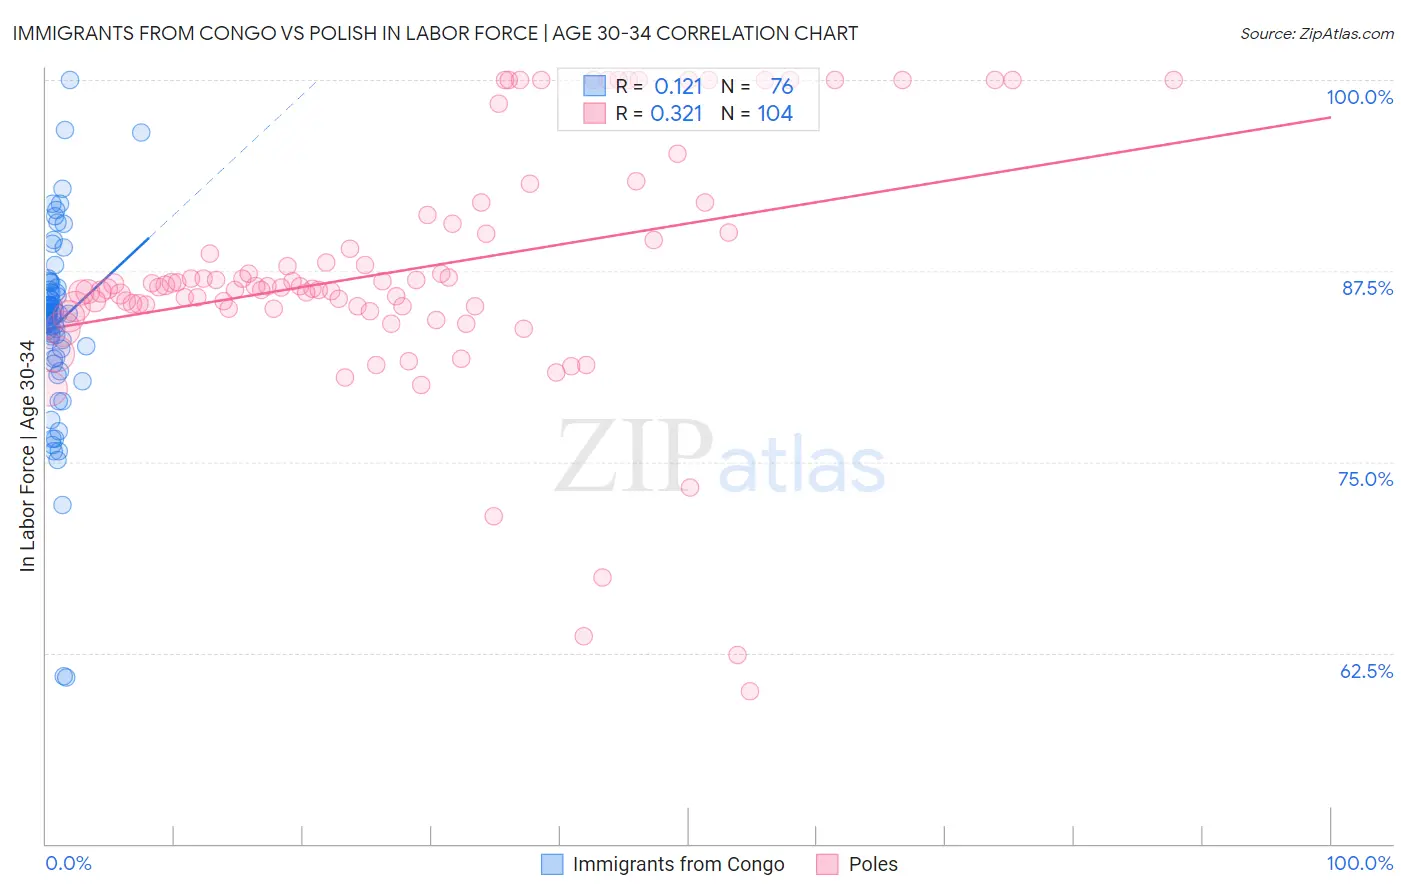
Immigrants from Congo vs Polish In Labor Force | Age 30-34 Correlation Chart
The statistical analysis conducted on geographies consisting of 92,110,351 people shows a poor positive correlation between the proportion of Immigrants from Congo and labor force participation rate among population between the ages 30 and 34 in the United States with a correlation coefficient (R) of 0.121 and weighted average of 84.6%. Similarly, the statistical analysis conducted on geographies consisting of 559,395,237 people shows a mild positive correlation between the proportion of Poles and labor force participation rate among population between the ages 30 and 34 in the United States with a correlation coefficient (R) of 0.321 and weighted average of 85.5%, a difference of 1.1%.
In Labor Force | Age 30-34 Correlation Summary
| Measurement | Immigrants from Congo | Polish |
| Minimum | 60.9% | 60.0% |
| Maximum | 100.0% | 100.0% |
| Range | 39.1% | 40.0% |
| Mean | 84.0% | 87.5% |
| Median | 84.7% | 86.5% |
| Interquartile 25% (IQ1) | 82.1% | 85.2% |
| Interquartile 75% (IQ3) | 86.3% | 90.3% |
| Interquartile Range (IQR) | 4.2% | 5.1% |
| Standard Deviation (Sample) | 6.3% | 8.0% |
| Standard Deviation (Population) | 6.2% | 7.9% |
Similar Demographics by In Labor Force | Age 30-34
Demographics Similar to Immigrants from Congo by In Labor Force | Age 30-34
In terms of in labor force | age 30-34, the demographic groups most similar to Immigrants from Congo are Costa Rican (84.6%, a difference of 0.0%), Taiwanese (84.6%, a difference of 0.0%), Immigrants from Philippines (84.6%, a difference of 0.010%), Nigerian (84.5%, a difference of 0.010%), and Immigrants from North America (84.6%, a difference of 0.030%).
| Demographics | Rating | Rank | In Labor Force | Age 30-34 |
| Immigrants | Nigeria | 42.5 /100 | #179 | Average 84.6% |
| Immigrants | Netherlands | 42.1 /100 | #180 | Average 84.6% |
| Moroccans | 40.3 /100 | #181 | Average 84.6% |
| Barbadians | 36.7 /100 | #182 | Fair 84.6% |
| Immigrants | Canada | 35.0 /100 | #183 | Fair 84.6% |
| Immigrants | North America | 33.3 /100 | #184 | Fair 84.6% |
| Immigrants | Philippines | 31.5 /100 | #185 | Fair 84.6% |
| Immigrants | Congo | 29.7 /100 | #186 | Fair 84.6% |
| Costa Ricans | 29.6 /100 | #187 | Fair 84.6% |
| Taiwanese | 29.4 /100 | #188 | Fair 84.6% |
| Nigerians | 28.9 /100 | #189 | Fair 84.5% |
| Immigrants | Zaire | 25.8 /100 | #190 | Fair 84.5% |
| Hungarians | 24.8 /100 | #191 | Fair 84.5% |
| Scandinavians | 24.7 /100 | #192 | Fair 84.5% |
| Immigrants | Costa Rica | 23.9 /100 | #193 | Fair 84.5% |
Demographics Similar to Poles by In Labor Force | Age 30-34
In terms of in labor force | age 30-34, the demographic groups most similar to Poles are Russian (85.5%, a difference of 0.0%), Immigrants from Turkey (85.5%, a difference of 0.010%), Czech (85.5%, a difference of 0.010%), Immigrants from Poland (85.5%, a difference of 0.010%), and Immigrants from Kenya (85.5%, a difference of 0.020%).
| Demographics | Rating | Rank | In Labor Force | Age 30-34 |
| Cape Verdeans | 99.7 /100 | #51 | Exceptional 85.6% |
| Slovenes | 99.7 /100 | #52 | Exceptional 85.6% |
| Filipinos | 99.6 /100 | #53 | Exceptional 85.5% |
| Immigrants | Kenya | 99.6 /100 | #54 | Exceptional 85.5% |
| Immigrants | Turkey | 99.6 /100 | #55 | Exceptional 85.5% |
| Czechs | 99.6 /100 | #56 | Exceptional 85.5% |
| Russians | 99.6 /100 | #57 | Exceptional 85.5% |
| Poles | 99.6 /100 | #58 | Exceptional 85.5% |
| Immigrants | Poland | 99.5 /100 | #59 | Exceptional 85.5% |
| Immigrants | France | 99.5 /100 | #60 | Exceptional 85.5% |
| Immigrants | Brazil | 99.5 /100 | #61 | Exceptional 85.5% |
| Soviet Union | 99.4 /100 | #62 | Exceptional 85.5% |
| Macedonians | 99.4 /100 | #63 | Exceptional 85.5% |
| Italians | 99.4 /100 | #64 | Exceptional 85.4% |
| Senegalese | 99.4 /100 | #65 | Exceptional 85.4% |