Ghanaian vs Immigrants from Poland Female Unemployment
COMPARE
Ghanaian
Immigrants from Poland
Female Unemployment
Female Unemployment Comparison
Ghanaians
Immigrants from Poland
5.9%
FEMALE UNEMPLOYMENT
0.0/ 100
METRIC RATING
273rd/ 347
METRIC RANK
5.3%
FEMALE UNEMPLOYMENT
50.0/ 100
METRIC RATING
174th/ 347
METRIC RANK
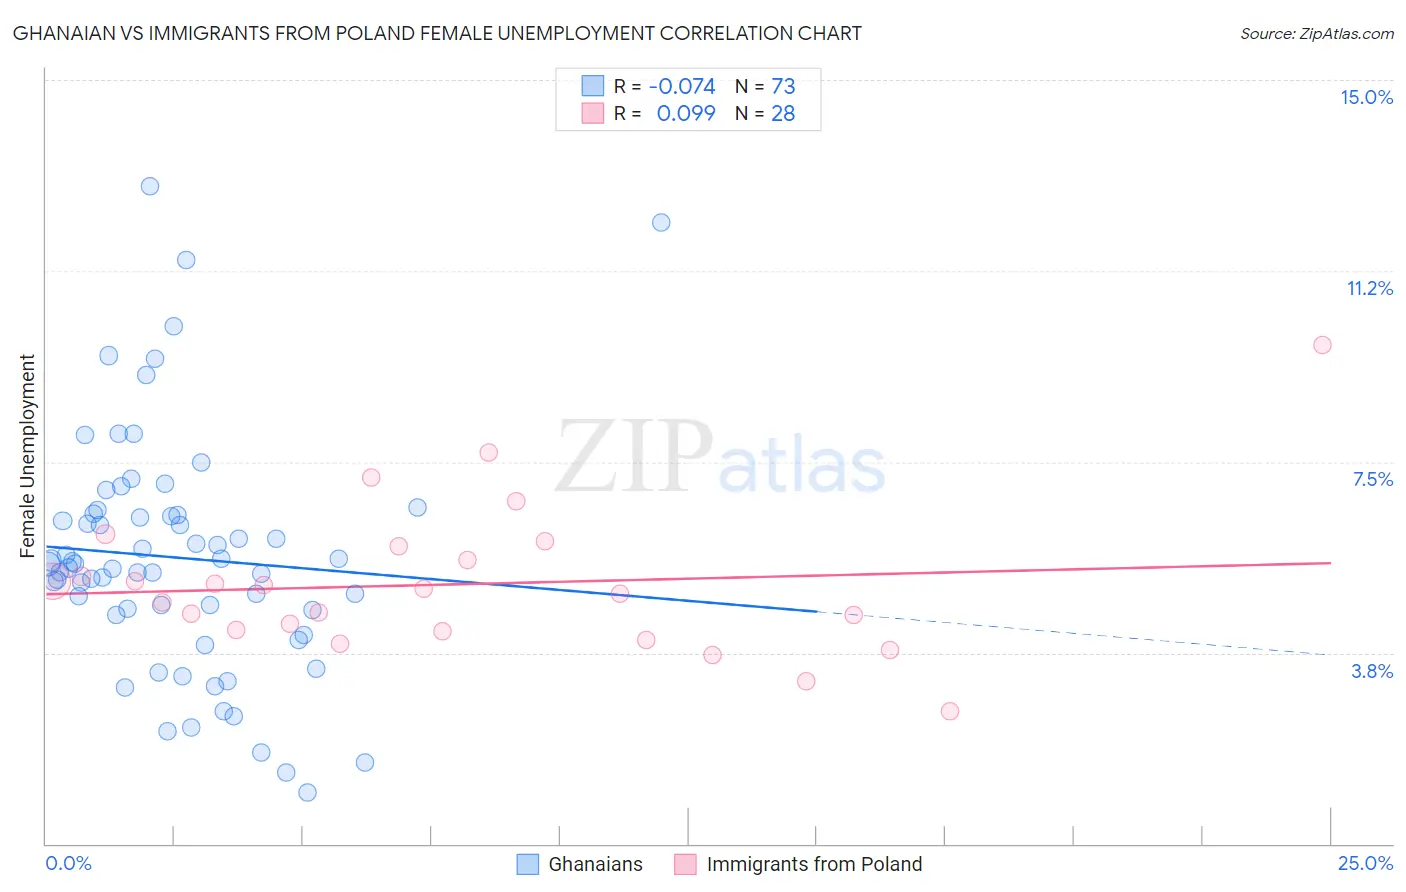
Ghanaian vs Immigrants from Poland Female Unemployment Correlation Chart
The statistical analysis conducted on geographies consisting of 190,507,316 people shows a slight negative correlation between the proportion of Ghanaians and unemploymnet rate among females in the United States with a correlation coefficient (R) of -0.074 and weighted average of 5.9%. Similarly, the statistical analysis conducted on geographies consisting of 303,909,658 people shows a slight positive correlation between the proportion of Immigrants from Poland and unemploymnet rate among females in the United States with a correlation coefficient (R) of 0.099 and weighted average of 5.3%, a difference of 13.1%.
Female Unemployment Correlation Summary
| Measurement | Ghanaian | Immigrants from Poland |
| Minimum | 1.0% | 2.6% |
| Maximum | 12.9% | 9.8% |
| Range | 11.9% | 7.2% |
| Mean | 5.6% | 5.1% |
| Median | 5.5% | 5.0% |
| Interquartile 25% (IQ1) | 4.5% | 4.2% |
| Interquartile 75% (IQ3) | 6.5% | 5.7% |
| Interquartile Range (IQR) | 1.9% | 1.5% |
| Standard Deviation (Sample) | 2.3% | 1.5% |
| Standard Deviation (Population) | 2.3% | 1.4% |
Similar Demographics by Female Unemployment
Demographics Similar to Ghanaians by Female Unemployment
In terms of female unemployment, the demographic groups most similar to Ghanaians are Lumbee (5.9%, a difference of 0.010%), African (5.9%, a difference of 0.080%), Central American (5.9%, a difference of 0.20%), Immigrants from Honduras (5.9%, a difference of 0.30%), and Senegalese (6.0%, a difference of 0.57%).
| Demographics | Rating | Rank | Female Unemployment |
| Cape Verdeans | 0.0 /100 | #266 | Tragic 5.9% |
| Nepalese | 0.0 /100 | #267 | Tragic 5.9% |
| Hondurans | 0.0 /100 | #268 | Tragic 5.9% |
| Immigrants | Western Africa | 0.0 /100 | #269 | Tragic 5.9% |
| Immigrants | Honduras | 0.0 /100 | #270 | Tragic 5.9% |
| Central Americans | 0.0 /100 | #271 | Tragic 5.9% |
| Lumbee | 0.0 /100 | #272 | Tragic 5.9% |
| Ghanaians | 0.0 /100 | #273 | Tragic 5.9% |
| Africans | 0.0 /100 | #274 | Tragic 5.9% |
| Senegalese | 0.0 /100 | #275 | Tragic 6.0% |
| Bahamians | 0.0 /100 | #276 | Tragic 6.0% |
| Immigrants | Ghana | 0.0 /100 | #277 | Tragic 6.0% |
| Yaqui | 0.0 /100 | #278 | Tragic 6.0% |
| Armenians | 0.0 /100 | #279 | Tragic 6.0% |
| Mexican American Indians | 0.0 /100 | #280 | Tragic 6.0% |
Demographics Similar to Immigrants from Poland by Female Unemployment
In terms of female unemployment, the demographic groups most similar to Immigrants from Poland are Iranian (5.3%, a difference of 0.020%), Immigrants from Uganda (5.3%, a difference of 0.040%), Immigrants from Laos (5.3%, a difference of 0.15%), Immigrants from Vietnam (5.3%, a difference of 0.15%), and Immigrants from Morocco (5.3%, a difference of 0.16%).
| Demographics | Rating | Rank | Female Unemployment |
| Immigrants | Thailand | 62.1 /100 | #167 | Good 5.2% |
| Sri Lankans | 59.4 /100 | #168 | Average 5.2% |
| Immigrants | Chile | 59.0 /100 | #169 | Average 5.2% |
| Spanish | 55.9 /100 | #170 | Average 5.2% |
| Immigrants | Denmark | 55.0 /100 | #171 | Average 5.2% |
| Immigrants | Uganda | 50.7 /100 | #172 | Average 5.3% |
| Iranians | 50.4 /100 | #173 | Average 5.3% |
| Immigrants | Poland | 50.0 /100 | #174 | Average 5.3% |
| Immigrants | Laos | 47.5 /100 | #175 | Average 5.3% |
| Immigrants | Vietnam | 47.5 /100 | #176 | Average 5.3% |
| Immigrants | Morocco | 47.4 /100 | #177 | Average 5.3% |
| Immigrants | Southern Europe | 46.2 /100 | #178 | Average 5.3% |
| Laotians | 45.1 /100 | #179 | Average 5.3% |
| Immigrants | Congo | 43.1 /100 | #180 | Average 5.3% |
| Taiwanese | 42.7 /100 | #181 | Average 5.3% |