German Russian vs Burmese In Labor Force | Age 25-29
COMPARE
German Russian
Burmese
In Labor Force | Age 25-29
In Labor Force | Age 25-29 Comparison
German Russians
Burmese
85.8%
IN LABOR FORCE | AGE 25-29
100.0/ 100
METRIC RATING
31st/ 347
METRIC RANK
85.1%
IN LABOR FORCE | AGE 25-29
95.9/ 100
METRIC RATING
90th/ 347
METRIC RANK
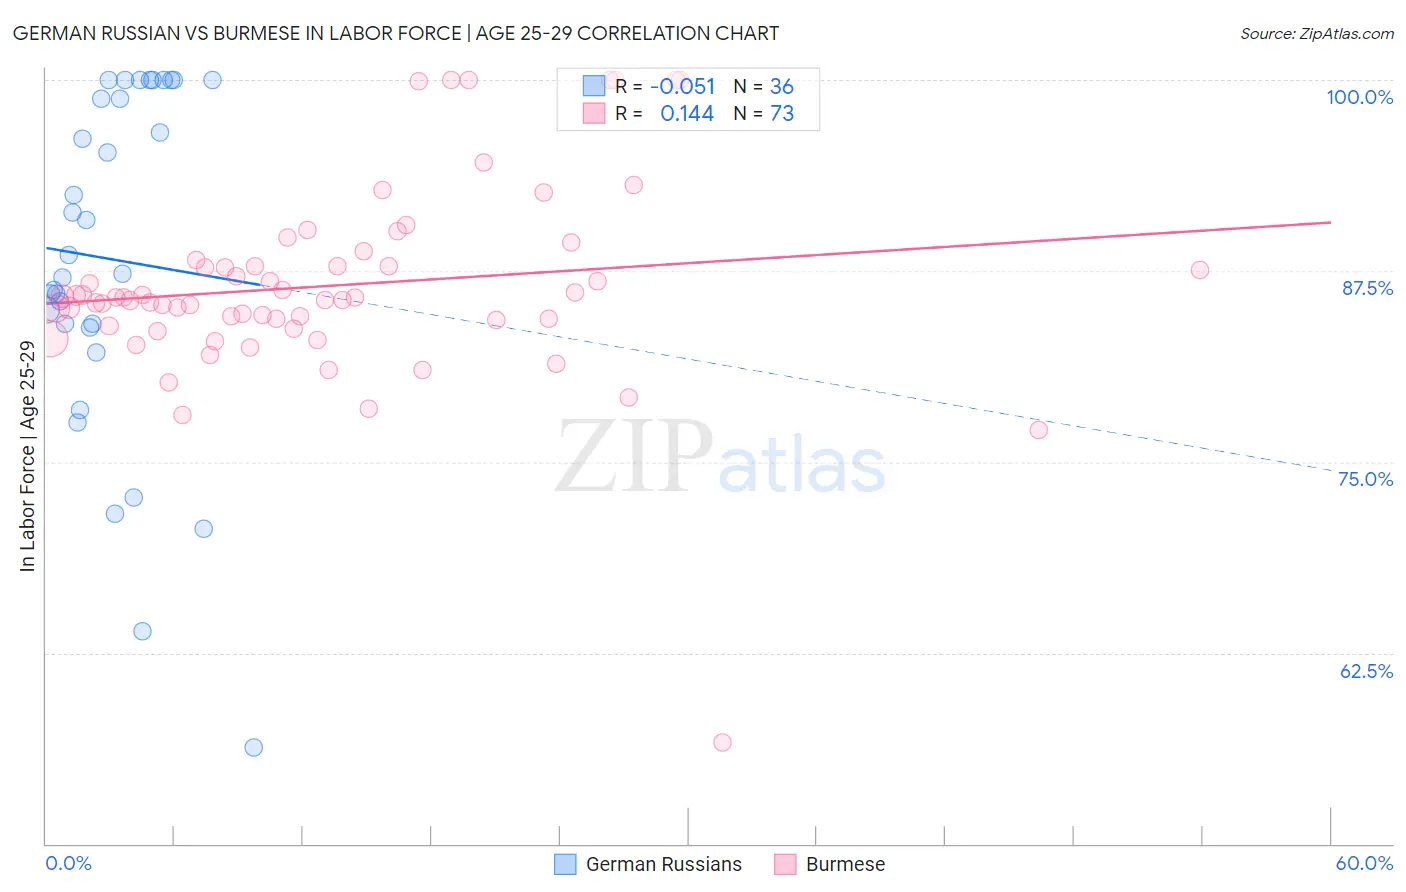
German Russian vs Burmese In Labor Force | Age 25-29 Correlation Chart
The statistical analysis conducted on geographies consisting of 96,455,675 people shows a slight negative correlation between the proportion of German Russians and labor force participation rate among population between the ages 25 and 29 in the United States with a correlation coefficient (R) of -0.051 and weighted average of 85.8%. Similarly, the statistical analysis conducted on geographies consisting of 465,170,348 people shows a poor positive correlation between the proportion of Burmese and labor force participation rate among population between the ages 25 and 29 in the United States with a correlation coefficient (R) of 0.144 and weighted average of 85.1%, a difference of 0.82%.
In Labor Force | Age 25-29 Correlation Summary
| Measurement | German Russian | Burmese |
| Minimum | 56.3% | 56.6% |
| Maximum | 100.0% | 100.0% |
| Range | 43.7% | 43.4% |
| Mean | 88.3% | 86.5% |
| Median | 87.9% | 85.8% |
| Interquartile 25% (IQ1) | 83.9% | 84.1% |
| Interquartile 75% (IQ3) | 99.4% | 88.0% |
| Interquartile Range (IQR) | 15.5% | 3.9% |
| Standard Deviation (Sample) | 11.3% | 6.4% |
| Standard Deviation (Population) | 11.1% | 6.4% |
Similar Demographics by In Labor Force | Age 25-29
Demographics Similar to German Russians by In Labor Force | Age 25-29
In terms of in labor force | age 25-29, the demographic groups most similar to German Russians are Slovak (85.8%, a difference of 0.0%), Immigrants from Bulgaria (85.8%, a difference of 0.0%), Immigrants from Serbia (85.9%, a difference of 0.010%), Lithuanian (85.8%, a difference of 0.030%), and Cypriot (85.8%, a difference of 0.040%).
| Demographics | Rating | Rank | In Labor Force | Age 25-29 |
| Immigrants | Eastern Africa | 100.0 /100 | #24 | Exceptional 86.0% |
| Sudanese | 100.0 /100 | #25 | Exceptional 85.9% |
| Immigrants | North Macedonia | 100.0 /100 | #26 | Exceptional 85.9% |
| Paraguayans | 100.0 /100 | #27 | Exceptional 85.9% |
| Ugandans | 100.0 /100 | #28 | Exceptional 85.9% |
| Immigrants | Liberia | 100.0 /100 | #29 | Exceptional 85.9% |
| Immigrants | Serbia | 100.0 /100 | #30 | Exceptional 85.9% |
| German Russians | 100.0 /100 | #31 | Exceptional 85.8% |
| Slovaks | 100.0 /100 | #32 | Exceptional 85.8% |
| Immigrants | Bulgaria | 100.0 /100 | #33 | Exceptional 85.8% |
| Lithuanians | 99.9 /100 | #34 | Exceptional 85.8% |
| Cypriots | 99.9 /100 | #35 | Exceptional 85.8% |
| Immigrants | Nepal | 99.9 /100 | #36 | Exceptional 85.8% |
| Poles | 99.9 /100 | #37 | Exceptional 85.8% |
| Sierra Leoneans | 99.9 /100 | #38 | Exceptional 85.8% |
Demographics Similar to Burmese by In Labor Force | Age 25-29
In terms of in labor force | age 25-29, the demographic groups most similar to Burmese are Immigrants from Moldova (85.1%, a difference of 0.010%), Immigrants from France (85.2%, a difference of 0.020%), Immigrants from Costa Rica (85.1%, a difference of 0.020%), French Canadian (85.2%, a difference of 0.030%), and Immigrants from Croatia (85.2%, a difference of 0.030%).
| Demographics | Rating | Rank | In Labor Force | Age 25-29 |
| Immigrants | Europe | 96.8 /100 | #83 | Exceptional 85.2% |
| Immigrants | Eastern Europe | 96.8 /100 | #84 | Exceptional 85.2% |
| Immigrants | Africa | 96.7 /100 | #85 | Exceptional 85.2% |
| Ukrainians | 96.7 /100 | #86 | Exceptional 85.2% |
| French Canadians | 96.5 /100 | #87 | Exceptional 85.2% |
| Immigrants | Croatia | 96.4 /100 | #88 | Exceptional 85.2% |
| Immigrants | France | 96.3 /100 | #89 | Exceptional 85.2% |
| Burmese | 95.9 /100 | #90 | Exceptional 85.1% |
| Immigrants | Moldova | 95.8 /100 | #91 | Exceptional 85.1% |
| Immigrants | Costa Rica | 95.5 /100 | #92 | Exceptional 85.1% |
| Austrians | 95.3 /100 | #93 | Exceptional 85.1% |
| Immigrants | Korea | 94.8 /100 | #94 | Exceptional 85.1% |
| Immigrants | Netherlands | 94.6 /100 | #95 | Exceptional 85.1% |
| Immigrants | Romania | 94.6 /100 | #96 | Exceptional 85.1% |
| Immigrants | Sudan | 94.3 /100 | #97 | Exceptional 85.1% |