German Russian vs Immigrants from Nigeria In Labor Force | Age 25-29
COMPARE
German Russian
Immigrants from Nigeria
In Labor Force | Age 25-29
In Labor Force | Age 25-29 Comparison
German Russians
Immigrants from Nigeria
85.8%
IN LABOR FORCE | AGE 25-29
100.0/ 100
METRIC RATING
31st/ 347
METRIC RANK
84.3%
IN LABOR FORCE | AGE 25-29
9.0/ 100
METRIC RATING
218th/ 347
METRIC RANK
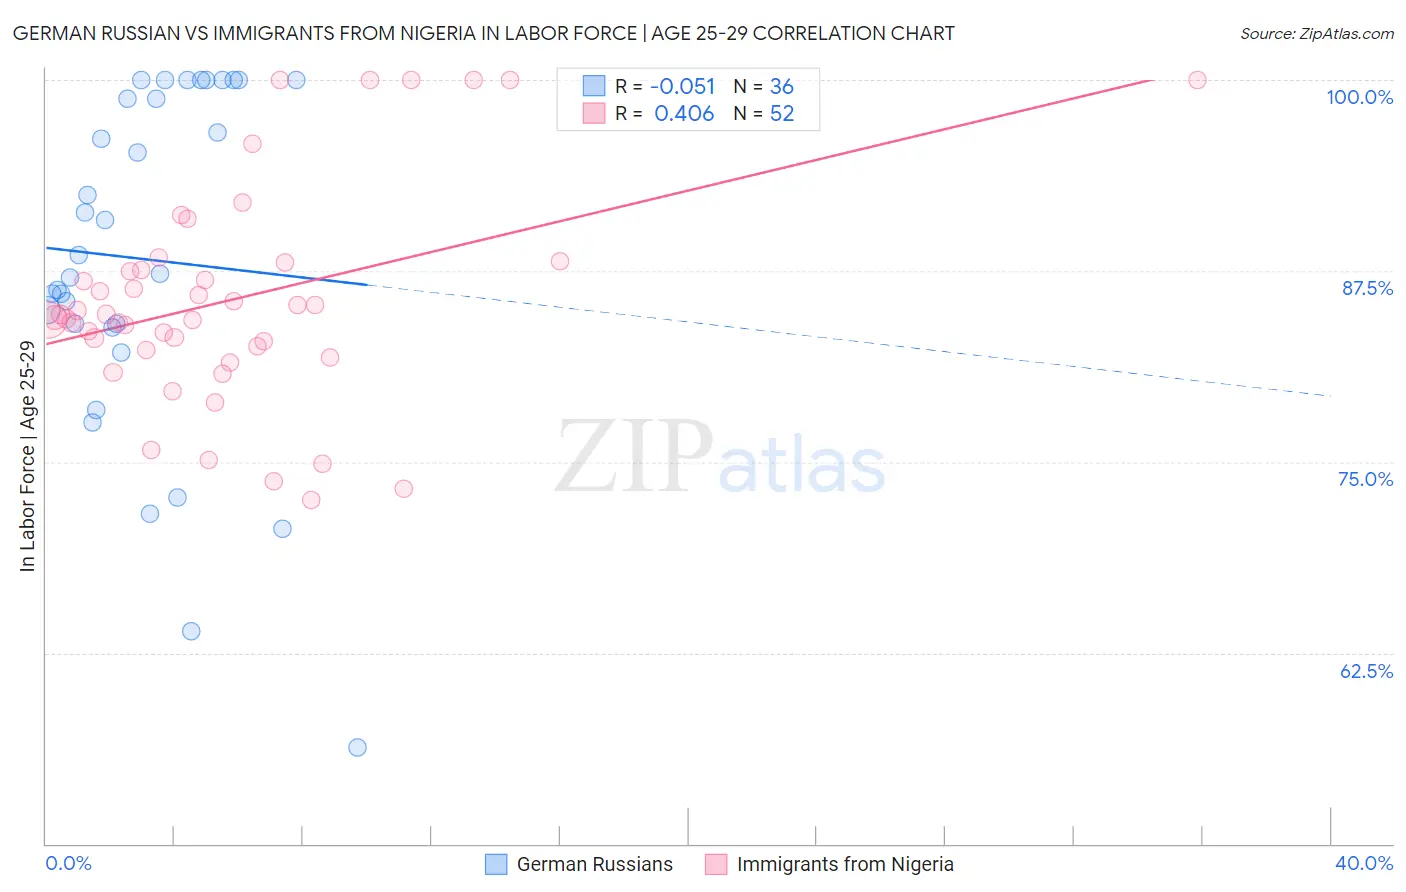
German Russian vs Immigrants from Nigeria In Labor Force | Age 25-29 Correlation Chart
The statistical analysis conducted on geographies consisting of 96,455,675 people shows a slight negative correlation between the proportion of German Russians and labor force participation rate among population between the ages 25 and 29 in the United States with a correlation coefficient (R) of -0.051 and weighted average of 85.8%. Similarly, the statistical analysis conducted on geographies consisting of 283,439,551 people shows a moderate positive correlation between the proportion of Immigrants from Nigeria and labor force participation rate among population between the ages 25 and 29 in the United States with a correlation coefficient (R) of 0.406 and weighted average of 84.3%, a difference of 1.8%.
In Labor Force | Age 25-29 Correlation Summary
| Measurement | German Russian | Immigrants from Nigeria |
| Minimum | 56.3% | 72.5% |
| Maximum | 100.0% | 100.0% |
| Range | 43.7% | 27.5% |
| Mean | 88.3% | 85.6% |
| Median | 87.9% | 84.5% |
| Interquartile 25% (IQ1) | 83.9% | 82.4% |
| Interquartile 75% (IQ3) | 99.4% | 87.8% |
| Interquartile Range (IQR) | 15.5% | 5.4% |
| Standard Deviation (Sample) | 11.3% | 7.0% |
| Standard Deviation (Population) | 11.1% | 6.9% |
Similar Demographics by In Labor Force | Age 25-29
Demographics Similar to German Russians by In Labor Force | Age 25-29
In terms of in labor force | age 25-29, the demographic groups most similar to German Russians are Slovak (85.8%, a difference of 0.0%), Immigrants from Bulgaria (85.8%, a difference of 0.0%), Immigrants from Serbia (85.9%, a difference of 0.010%), Lithuanian (85.8%, a difference of 0.030%), and Cypriot (85.8%, a difference of 0.040%).
| Demographics | Rating | Rank | In Labor Force | Age 25-29 |
| Immigrants | Eastern Africa | 100.0 /100 | #24 | Exceptional 86.0% |
| Sudanese | 100.0 /100 | #25 | Exceptional 85.9% |
| Immigrants | North Macedonia | 100.0 /100 | #26 | Exceptional 85.9% |
| Paraguayans | 100.0 /100 | #27 | Exceptional 85.9% |
| Ugandans | 100.0 /100 | #28 | Exceptional 85.9% |
| Immigrants | Liberia | 100.0 /100 | #29 | Exceptional 85.9% |
| Immigrants | Serbia | 100.0 /100 | #30 | Exceptional 85.9% |
| German Russians | 100.0 /100 | #31 | Exceptional 85.8% |
| Slovaks | 100.0 /100 | #32 | Exceptional 85.8% |
| Immigrants | Bulgaria | 100.0 /100 | #33 | Exceptional 85.8% |
| Lithuanians | 99.9 /100 | #34 | Exceptional 85.8% |
| Cypriots | 99.9 /100 | #35 | Exceptional 85.8% |
| Immigrants | Nepal | 99.9 /100 | #36 | Exceptional 85.8% |
| Poles | 99.9 /100 | #37 | Exceptional 85.8% |
| Sierra Leoneans | 99.9 /100 | #38 | Exceptional 85.8% |
Demographics Similar to Immigrants from Nigeria by In Labor Force | Age 25-29
In terms of in labor force | age 25-29, the demographic groups most similar to Immigrants from Nigeria are Immigrants from Saudi Arabia (84.3%, a difference of 0.0%), Israeli (84.3%, a difference of 0.010%), Immigrants from Ecuador (84.3%, a difference of 0.010%), Lebanese (84.3%, a difference of 0.040%), and Immigrants from Syria (84.3%, a difference of 0.040%).
| Demographics | Rating | Rank | In Labor Force | Age 25-29 |
| Immigrants | Venezuela | 12.6 /100 | #211 | Poor 84.3% |
| Sub-Saharan Africans | 11.7 /100 | #212 | Poor 84.3% |
| Japanese | 11.4 /100 | #213 | Poor 84.3% |
| Lebanese | 11.1 /100 | #214 | Poor 84.3% |
| Immigrants | Syria | 10.7 /100 | #215 | Poor 84.3% |
| Israelis | 9.3 /100 | #216 | Tragic 84.3% |
| Immigrants | Ecuador | 9.3 /100 | #217 | Tragic 84.3% |
| Immigrants | Nigeria | 9.0 /100 | #218 | Tragic 84.3% |
| Immigrants | Saudi Arabia | 8.8 /100 | #219 | Tragic 84.3% |
| Nigerians | 7.2 /100 | #220 | Tragic 84.3% |
| Arabs | 6.8 /100 | #221 | Tragic 84.2% |
| Jordanians | 6.7 /100 | #222 | Tragic 84.2% |
| Scotch-Irish | 6.5 /100 | #223 | Tragic 84.2% |
| Immigrants | West Indies | 6.0 /100 | #224 | Tragic 84.2% |
| Koreans | 5.9 /100 | #225 | Tragic 84.2% |