French Canadian vs Basque In Labor Force | Age 45-54
COMPARE
French Canadian
Basque
In Labor Force | Age 45-54
In Labor Force | Age 45-54 Comparison
French Canadians
Basques
82.5%
IN LABOR FORCE | AGE 45-54
15.4/ 100
METRIC RATING
200th/ 347
METRIC RANK
82.0%
IN LABOR FORCE | AGE 45-54
1.2/ 100
METRIC RATING
236th/ 347
METRIC RANK
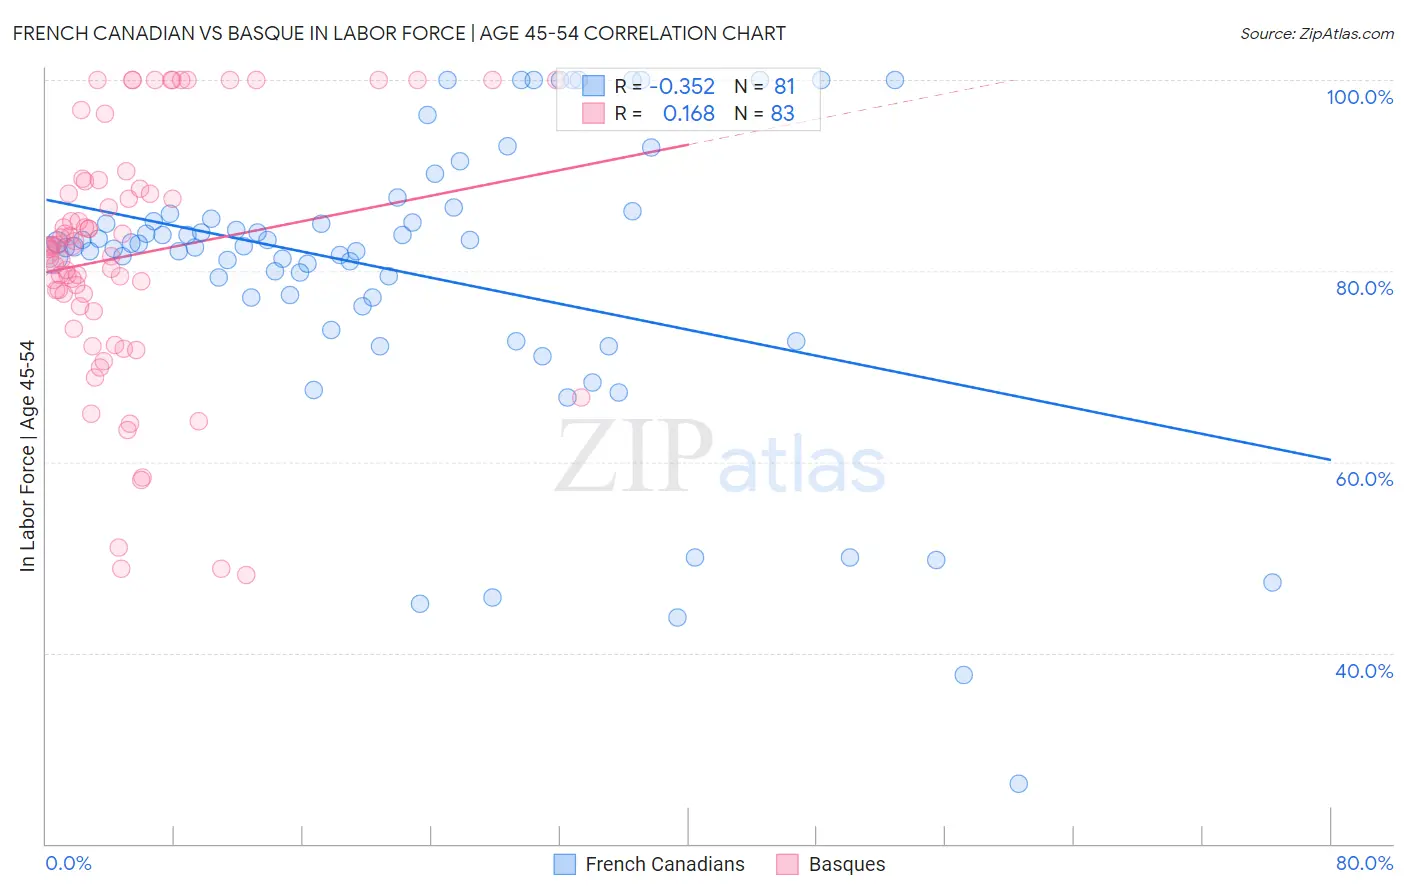
French Canadian vs Basque In Labor Force | Age 45-54 Correlation Chart
The statistical analysis conducted on geographies consisting of 502,209,995 people shows a mild negative correlation between the proportion of French Canadians and labor force participation rate among population between the ages 45 and 54 in the United States with a correlation coefficient (R) of -0.352 and weighted average of 82.5%. Similarly, the statistical analysis conducted on geographies consisting of 165,745,379 people shows a poor positive correlation between the proportion of Basques and labor force participation rate among population between the ages 45 and 54 in the United States with a correlation coefficient (R) of 0.168 and weighted average of 82.0%, a difference of 0.60%.
In Labor Force | Age 45-54 Correlation Summary
| Measurement | French Canadian | Basque |
| Minimum | 26.3% | 48.1% |
| Maximum | 100.0% | 100.0% |
| Range | 73.7% | 51.9% |
| Mean | 79.7% | 81.6% |
| Median | 82.6% | 82.5% |
| Interquartile 25% (IQ1) | 76.8% | 76.3% |
| Interquartile 75% (IQ3) | 85.7% | 88.6% |
| Interquartile Range (IQR) | 8.9% | 12.3% |
| Standard Deviation (Sample) | 15.4% | 12.9% |
| Standard Deviation (Population) | 15.3% | 12.8% |
Similar Demographics by In Labor Force | Age 45-54
Demographics Similar to French Canadians by In Labor Force | Age 45-54
In terms of in labor force | age 45-54, the demographic groups most similar to French Canadians are Moroccan (82.5%, a difference of 0.0%), Canadian (82.4%, a difference of 0.010%), Immigrants from Western Asia (82.4%, a difference of 0.010%), Immigrants from Denmark (82.5%, a difference of 0.040%), and Immigrants from North America (82.5%, a difference of 0.050%).
| Demographics | Rating | Rank | In Labor Force | Age 45-54 |
| Australians | 20.8 /100 | #193 | Fair 82.5% |
| Immigrants | Norway | 20.7 /100 | #194 | Fair 82.5% |
| Immigrants | Canada | 20.0 /100 | #195 | Fair 82.5% |
| Immigrants | North America | 18.8 /100 | #196 | Poor 82.5% |
| Lebanese | 18.2 /100 | #197 | Poor 82.5% |
| Immigrants | Denmark | 17.9 /100 | #198 | Poor 82.5% |
| Moroccans | 15.7 /100 | #199 | Poor 82.5% |
| French Canadians | 15.4 /100 | #200 | Poor 82.5% |
| Canadians | 15.1 /100 | #201 | Poor 82.4% |
| Immigrants | Western Asia | 14.9 /100 | #202 | Poor 82.4% |
| Arabs | 11.6 /100 | #203 | Poor 82.4% |
| Immigrants | Western Europe | 10.9 /100 | #204 | Poor 82.4% |
| Senegalese | 9.5 /100 | #205 | Tragic 82.4% |
| Welsh | 9.2 /100 | #206 | Tragic 82.3% |
| Immigrants | Cabo Verde | 8.6 /100 | #207 | Tragic 82.3% |
Demographics Similar to Basques by In Labor Force | Age 45-54
In terms of in labor force | age 45-54, the demographic groups most similar to Basques are Subsaharan African (82.0%, a difference of 0.010%), Immigrants from Trinidad and Tobago (82.0%, a difference of 0.010%), Trinidadian and Tobagonian (81.9%, a difference of 0.010%), Immigrants from Thailand (81.9%, a difference of 0.040%), and Immigrants from El Salvador (81.9%, a difference of 0.050%).
| Demographics | Rating | Rank | In Labor Force | Age 45-54 |
| Immigrants | Burma/Myanmar | 1.9 /100 | #229 | Tragic 82.0% |
| Jamaicans | 1.8 /100 | #230 | Tragic 82.0% |
| Immigrants | Senegal | 1.7 /100 | #231 | Tragic 82.0% |
| Immigrants | Portugal | 1.7 /100 | #232 | Tragic 82.0% |
| Malaysians | 1.7 /100 | #233 | Tragic 82.0% |
| Salvadorans | 1.7 /100 | #234 | Tragic 82.0% |
| Sub-Saharan Africans | 1.2 /100 | #235 | Tragic 82.0% |
| Basques | 1.2 /100 | #236 | Tragic 82.0% |
| Immigrants | Trinidad and Tobago | 1.2 /100 | #237 | Tragic 82.0% |
| Trinidadians and Tobagonians | 1.1 /100 | #238 | Tragic 81.9% |
| Immigrants | Thailand | 1.0 /100 | #239 | Tragic 81.9% |
| Immigrants | El Salvador | 1.0 /100 | #240 | Tragic 81.9% |
| Immigrants | Cambodia | 0.8 /100 | #241 | Tragic 81.9% |
| Whites/Caucasians | 0.7 /100 | #242 | Tragic 81.9% |
| Samoans | 0.6 /100 | #243 | Tragic 81.8% |