Immigrants from Cambodia vs Serbian In Labor Force | Age 20-24
COMPARE
Immigrants from Cambodia
Serbian
In Labor Force | Age 20-24
In Labor Force | Age 20-24 Comparison
Immigrants from Cambodia
Serbians
75.4%
IN LABOR FORCE | AGE 20-24
76.7/ 100
METRIC RATING
148th/ 347
METRIC RANK
77.3%
IN LABOR FORCE | AGE 20-24
100.0/ 100
METRIC RATING
48th/ 347
METRIC RANK
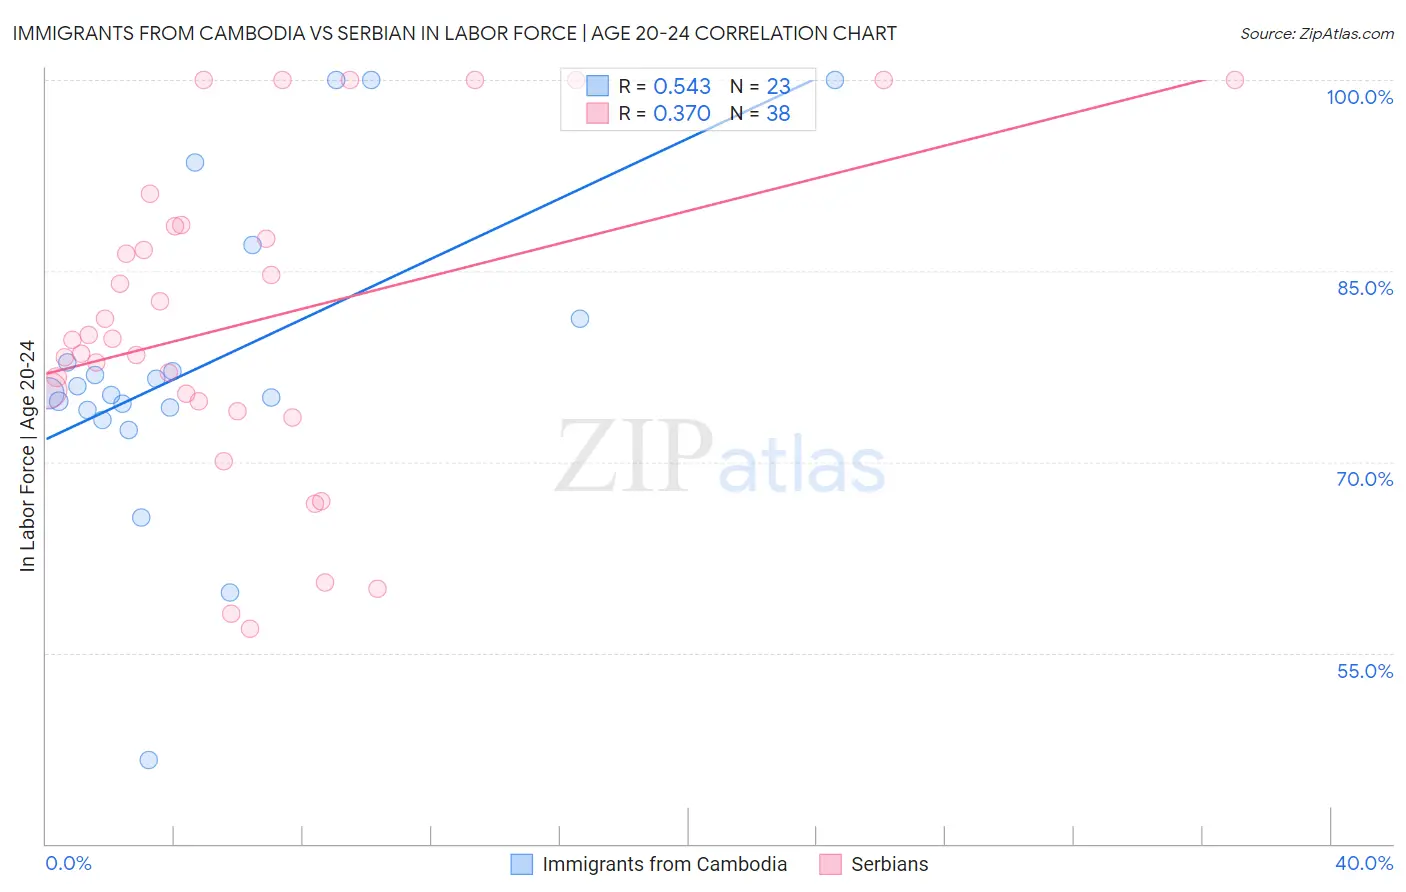
Immigrants from Cambodia vs Serbian In Labor Force | Age 20-24 Correlation Chart
The statistical analysis conducted on geographies consisting of 205,146,511 people shows a substantial positive correlation between the proportion of Immigrants from Cambodia and labor force participation rate among population between the ages 20 and 24 in the United States with a correlation coefficient (R) of 0.543 and weighted average of 75.4%. Similarly, the statistical analysis conducted on geographies consisting of 267,532,940 people shows a mild positive correlation between the proportion of Serbians and labor force participation rate among population between the ages 20 and 24 in the United States with a correlation coefficient (R) of 0.370 and weighted average of 77.3%, a difference of 2.5%.
In Labor Force | Age 20-24 Correlation Summary
| Measurement | Immigrants from Cambodia | Serbian |
| Minimum | 46.5% | 56.9% |
| Maximum | 100.0% | 100.0% |
| Range | 53.5% | 43.1% |
| Mean | 77.7% | 81.0% |
| Median | 75.4% | 79.6% |
| Interquartile 25% (IQ1) | 74.1% | 74.7% |
| Interquartile 75% (IQ3) | 81.2% | 88.5% |
| Interquartile Range (IQR) | 7.1% | 13.7% |
| Standard Deviation (Sample) | 12.4% | 12.3% |
| Standard Deviation (Population) | 12.1% | 12.2% |
Similar Demographics by In Labor Force | Age 20-24
Demographics Similar to Immigrants from Cambodia by In Labor Force | Age 20-24
In terms of in labor force | age 20-24, the demographic groups most similar to Immigrants from Cambodia are Ugandan (75.4%, a difference of 0.010%), Comanche (75.4%, a difference of 0.020%), Mexican American Indian (75.4%, a difference of 0.040%), Salvadoran (75.3%, a difference of 0.040%), and Paiute (75.3%, a difference of 0.050%).
| Demographics | Rating | Rank | In Labor Force | Age 20-24 |
| Romanians | 84.1 /100 | #141 | Excellent 75.5% |
| Blackfeet | 83.6 /100 | #142 | Excellent 75.5% |
| Spaniards | 82.0 /100 | #143 | Excellent 75.5% |
| Bhutanese | 80.8 /100 | #144 | Excellent 75.4% |
| Koreans | 79.7 /100 | #145 | Good 75.4% |
| Mexican American Indians | 78.8 /100 | #146 | Good 75.4% |
| Comanche | 77.6 /100 | #147 | Good 75.4% |
| Immigrants | Cambodia | 76.7 /100 | #148 | Good 75.4% |
| Ugandans | 76.1 /100 | #149 | Good 75.4% |
| Salvadorans | 74.8 /100 | #150 | Good 75.3% |
| Paiute | 74.1 /100 | #151 | Good 75.3% |
| Lebanese | 73.5 /100 | #152 | Good 75.3% |
| Guatemalans | 72.3 /100 | #153 | Good 75.3% |
| Osage | 72.3 /100 | #154 | Good 75.3% |
| Immigrants | Guatemala | 71.9 /100 | #155 | Good 75.3% |
Demographics Similar to Serbians by In Labor Force | Age 20-24
In terms of in labor force | age 20-24, the demographic groups most similar to Serbians are Chinese (77.3%, a difference of 0.010%), Ethiopian (77.3%, a difference of 0.050%), Malaysian (77.2%, a difference of 0.050%), Croatian (77.2%, a difference of 0.060%), and Indonesian (77.2%, a difference of 0.060%).
| Demographics | Rating | Rank | In Labor Force | Age 20-24 |
| Immigrants | Congo | 100.0 /100 | #41 | Exceptional 77.4% |
| French | 100.0 /100 | #42 | Exceptional 77.4% |
| Immigrants | Laos | 100.0 /100 | #43 | Exceptional 77.4% |
| Fijians | 100.0 /100 | #44 | Exceptional 77.4% |
| Native Hawaiians | 100.0 /100 | #45 | Exceptional 77.4% |
| Samoans | 100.0 /100 | #46 | Exceptional 77.4% |
| Ethiopians | 100.0 /100 | #47 | Exceptional 77.3% |
| Serbians | 100.0 /100 | #48 | Exceptional 77.3% |
| Chinese | 100.0 /100 | #49 | Exceptional 77.3% |
| Malaysians | 100.0 /100 | #50 | Exceptional 77.2% |
| Croatians | 100.0 /100 | #51 | Exceptional 77.2% |
| Indonesians | 100.0 /100 | #52 | Exceptional 77.2% |
| Immigrants | Azores | 100.0 /100 | #53 | Exceptional 77.2% |
| Celtics | 99.9 /100 | #54 | Exceptional 77.1% |
| Immigrants | Liberia | 99.9 /100 | #55 | Exceptional 77.1% |