Finnish vs Yaqui In Labor Force | Age 16-19
COMPARE
Finnish
Yaqui
In Labor Force | Age 16-19
In Labor Force | Age 16-19 Comparison
Finns
Yaqui
43.9%
IN LABOR FORCE | AGE 16-19
100.0/ 100
METRIC RATING
12th/ 347
METRIC RANK
37.1%
IN LABOR FORCE | AGE 16-19
74.4/ 100
METRIC RATING
159th/ 347
METRIC RANK
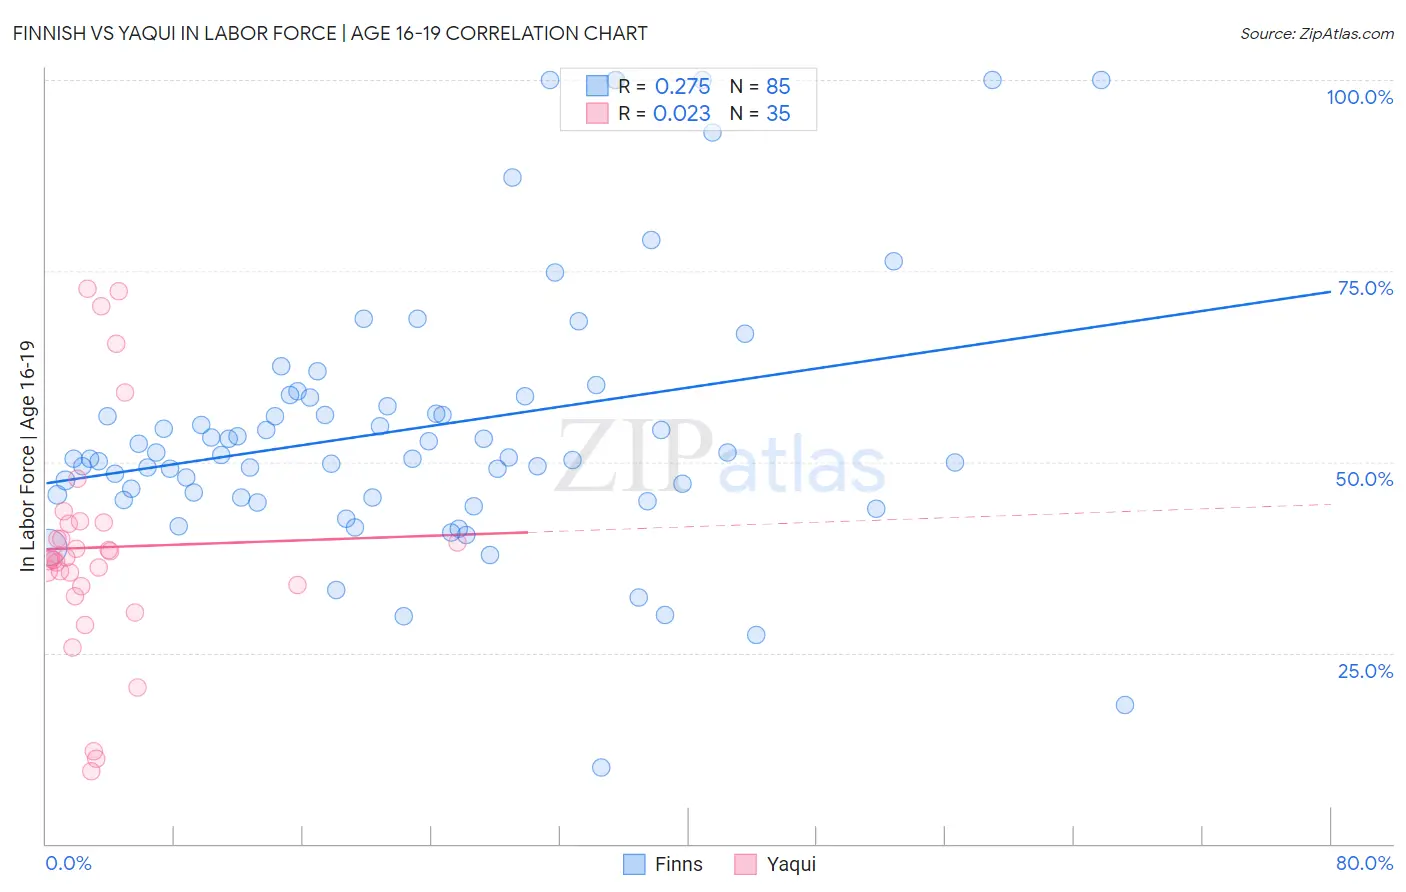
Finnish vs Yaqui In Labor Force | Age 16-19 Correlation Chart
The statistical analysis conducted on geographies consisting of 403,764,919 people shows a weak positive correlation between the proportion of Finns and labor force participation rate among population between the ages 16 and 19 in the United States with a correlation coefficient (R) of 0.275 and weighted average of 43.9%. Similarly, the statistical analysis conducted on geographies consisting of 107,656,749 people shows no correlation between the proportion of Yaqui and labor force participation rate among population between the ages 16 and 19 in the United States with a correlation coefficient (R) of 0.023 and weighted average of 37.1%, a difference of 18.5%.
In Labor Force | Age 16-19 Correlation Summary
| Measurement | Finnish | Yaqui |
| Minimum | 10.0% | 9.5% |
| Maximum | 100.0% | 72.6% |
| Range | 90.0% | 63.1% |
| Mean | 54.5% | 38.8% |
| Median | 50.6% | 37.3% |
| Interquartile 25% (IQ1) | 45.4% | 33.7% |
| Interquartile 75% (IQ3) | 58.5% | 42.1% |
| Interquartile Range (IQR) | 13.1% | 8.4% |
| Standard Deviation (Sample) | 17.8% | 15.0% |
| Standard Deviation (Population) | 17.7% | 14.8% |
Similar Demographics by In Labor Force | Age 16-19
Demographics Similar to Finns by In Labor Force | Age 16-19
In terms of in labor force | age 16-19, the demographic groups most similar to Finns are Dutch (43.8%, a difference of 0.19%), Chippewa (43.8%, a difference of 0.29%), Swedish (44.1%, a difference of 0.46%), German (44.2%, a difference of 0.54%), and Slovene (43.7%, a difference of 0.55%).
| Demographics | Rating | Rank | In Labor Force | Age 16-19 |
| Alaskan Athabascans | 100.0 /100 | #5 | Exceptional 45.2% |
| Somalis | 100.0 /100 | #6 | Exceptional 45.1% |
| Danes | 100.0 /100 | #7 | Exceptional 44.7% |
| Immigrants | Cabo Verde | 100.0 /100 | #8 | Exceptional 44.7% |
| Cape Verdeans | 100.0 /100 | #9 | Exceptional 44.5% |
| Germans | 100.0 /100 | #10 | Exceptional 44.2% |
| Swedes | 100.0 /100 | #11 | Exceptional 44.1% |
| Finns | 100.0 /100 | #12 | Exceptional 43.9% |
| Dutch | 100.0 /100 | #13 | Exceptional 43.8% |
| Chippewa | 100.0 /100 | #14 | Exceptional 43.8% |
| Slovenes | 100.0 /100 | #15 | Exceptional 43.7% |
| Czechs | 100.0 /100 | #16 | Exceptional 43.6% |
| Scandinavians | 100.0 /100 | #17 | Exceptional 43.6% |
| French Canadians | 100.0 /100 | #18 | Exceptional 43.6% |
| Belgians | 100.0 /100 | #19 | Exceptional 43.4% |
Demographics Similar to Yaqui by In Labor Force | Age 16-19
In terms of in labor force | age 16-19, the demographic groups most similar to Yaqui are Immigrants from Saudi Arabia (37.0%, a difference of 0.030%), Ute (37.1%, a difference of 0.080%), Immigrants from Brazil (37.1%, a difference of 0.14%), Cambodian (37.0%, a difference of 0.18%), and Immigrants from Jordan (36.9%, a difference of 0.31%).
| Demographics | Rating | Rank | In Labor Force | Age 16-19 |
| Immigrants | Sierra Leone | 83.6 /100 | #152 | Excellent 37.3% |
| Arapaho | 81.8 /100 | #153 | Excellent 37.3% |
| Immigrants | Bulgaria | 81.6 /100 | #154 | Excellent 37.3% |
| Immigrants | Lithuania | 80.7 /100 | #155 | Excellent 37.2% |
| Kiowa | 80.4 /100 | #156 | Excellent 37.2% |
| Immigrants | Brazil | 76.5 /100 | #157 | Good 37.1% |
| Ute | 75.7 /100 | #158 | Good 37.1% |
| Yaqui | 74.4 /100 | #159 | Good 37.1% |
| Immigrants | Saudi Arabia | 73.9 /100 | #160 | Good 37.0% |
| Cambodians | 71.5 /100 | #161 | Good 37.0% |
| Immigrants | Jordan | 69.5 /100 | #162 | Good 36.9% |
| Bermudans | 69.3 /100 | #163 | Good 36.9% |
| Immigrants | Kuwait | 68.9 /100 | #164 | Good 36.9% |
| Yakama | 66.9 /100 | #165 | Good 36.9% |
| Immigrants | Western Africa | 66.7 /100 | #166 | Good 36.9% |