Fijian vs Puerto Rican In Labor Force | Age 45-54
COMPARE
Fijian
Puerto Rican
In Labor Force | Age 45-54
In Labor Force | Age 45-54 Comparison
Fijians
Puerto Ricans
80.2%
IN LABOR FORCE | AGE 45-54
0.0/ 100
METRIC RATING
300th/ 347
METRIC RANK
75.9%
IN LABOR FORCE | AGE 45-54
0.0/ 100
METRIC RATING
339th/ 347
METRIC RANK
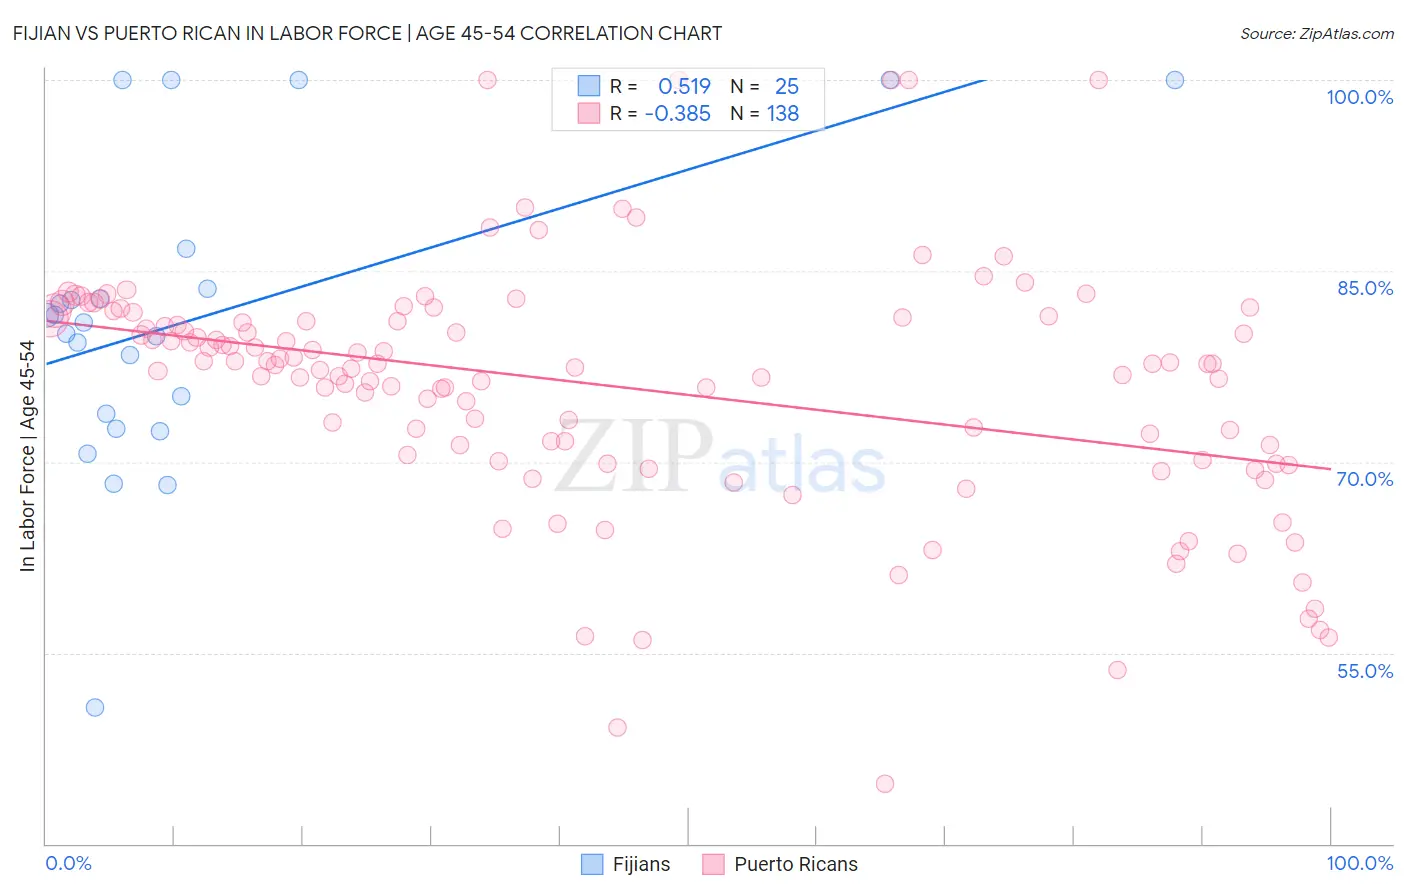
Fijian vs Puerto Rican In Labor Force | Age 45-54 Correlation Chart
The statistical analysis conducted on geographies consisting of 55,946,141 people shows a substantial positive correlation between the proportion of Fijians and labor force participation rate among population between the ages 45 and 54 in the United States with a correlation coefficient (R) of 0.519 and weighted average of 80.2%. Similarly, the statistical analysis conducted on geographies consisting of 527,669,276 people shows a mild negative correlation between the proportion of Puerto Ricans and labor force participation rate among population between the ages 45 and 54 in the United States with a correlation coefficient (R) of -0.385 and weighted average of 75.9%, a difference of 5.7%.
In Labor Force | Age 45-54 Correlation Summary
| Measurement | Fijian | Puerto Rican |
| Minimum | 50.7% | 44.7% |
| Maximum | 100.0% | 100.0% |
| Range | 49.3% | 55.3% |
| Mean | 81.3% | 76.0% |
| Median | 80.9% | 77.7% |
| Interquartile 25% (IQ1) | 73.2% | 70.5% |
| Interquartile 75% (IQ3) | 85.2% | 81.4% |
| Interquartile Range (IQR) | 12.0% | 10.9% |
| Standard Deviation (Sample) | 12.0% | 9.6% |
| Standard Deviation (Population) | 11.7% | 9.5% |
Similar Demographics by In Labor Force | Age 45-54
Demographics Similar to Fijians by In Labor Force | Age 45-54
In terms of in labor force | age 45-54, the demographic groups most similar to Fijians are Dominican (80.3%, a difference of 0.0%), Spanish American Indian (80.2%, a difference of 0.010%), Immigrants from Central America (80.2%, a difference of 0.090%), Marshallese (80.3%, a difference of 0.11%), and American (80.4%, a difference of 0.15%).
| Demographics | Rating | Rank | In Labor Force | Age 45-54 |
| Osage | 0.0 /100 | #293 | Tragic 80.6% |
| Yakama | 0.0 /100 | #294 | Tragic 80.6% |
| Nepalese | 0.0 /100 | #295 | Tragic 80.5% |
| Africans | 0.0 /100 | #296 | Tragic 80.5% |
| Americans | 0.0 /100 | #297 | Tragic 80.4% |
| Marshallese | 0.0 /100 | #298 | Tragic 80.3% |
| Dominicans | 0.0 /100 | #299 | Tragic 80.3% |
| Fijians | 0.0 /100 | #300 | Tragic 80.2% |
| Spanish American Indians | 0.0 /100 | #301 | Tragic 80.2% |
| Immigrants | Central America | 0.0 /100 | #302 | Tragic 80.2% |
| Immigrants | Azores | 0.0 /100 | #303 | Tragic 80.1% |
| Hispanics or Latinos | 0.0 /100 | #304 | Tragic 80.1% |
| Immigrants | Dominican Republic | 0.0 /100 | #305 | Tragic 80.1% |
| Spanish Americans | 0.0 /100 | #306 | Tragic 80.1% |
| Blackfeet | 0.0 /100 | #307 | Tragic 80.0% |
Demographics Similar to Puerto Ricans by In Labor Force | Age 45-54
In terms of in labor force | age 45-54, the demographic groups most similar to Puerto Ricans are Lumbee (75.6%, a difference of 0.46%), Yuman (76.3%, a difference of 0.48%), Pueblo (75.5%, a difference of 0.58%), Ute (76.6%, a difference of 0.89%), and Paiute (76.7%, a difference of 0.95%).
| Demographics | Rating | Rank | In Labor Force | Age 45-54 |
| Menominee | 0.0 /100 | #332 | Tragic 77.4% |
| Natives/Alaskans | 0.0 /100 | #333 | Tragic 77.1% |
| Apache | 0.0 /100 | #334 | Tragic 77.1% |
| Arapaho | 0.0 /100 | #335 | Tragic 77.1% |
| Paiute | 0.0 /100 | #336 | Tragic 76.7% |
| Ute | 0.0 /100 | #337 | Tragic 76.6% |
| Yuman | 0.0 /100 | #338 | Tragic 76.3% |
| Puerto Ricans | 0.0 /100 | #339 | Tragic 75.9% |
| Lumbee | 0.0 /100 | #340 | Tragic 75.6% |
| Pueblo | 0.0 /100 | #341 | Tragic 75.5% |
| Tohono O'odham | 0.0 /100 | #342 | Tragic 75.1% |
| Hopi | 0.0 /100 | #343 | Tragic 75.0% |
| Immigrants | Yemen | 0.0 /100 | #344 | Tragic 74.4% |
| Houma | 0.0 /100 | #345 | Tragic 74.1% |
| Pima | 0.0 /100 | #346 | Tragic 72.8% |