Fijian vs Immigrants from Italy In Labor Force | Age 30-34
COMPARE
Fijian
Immigrants from Italy
In Labor Force | Age 30-34
In Labor Force | Age 30-34 Comparison
Fijians
Immigrants from Italy
83.4%
IN LABOR FORCE | AGE 30-34
0.0/ 100
METRIC RATING
278th/ 347
METRIC RANK
85.7%
IN LABOR FORCE | AGE 30-34
99.9/ 100
METRIC RATING
41st/ 347
METRIC RANK
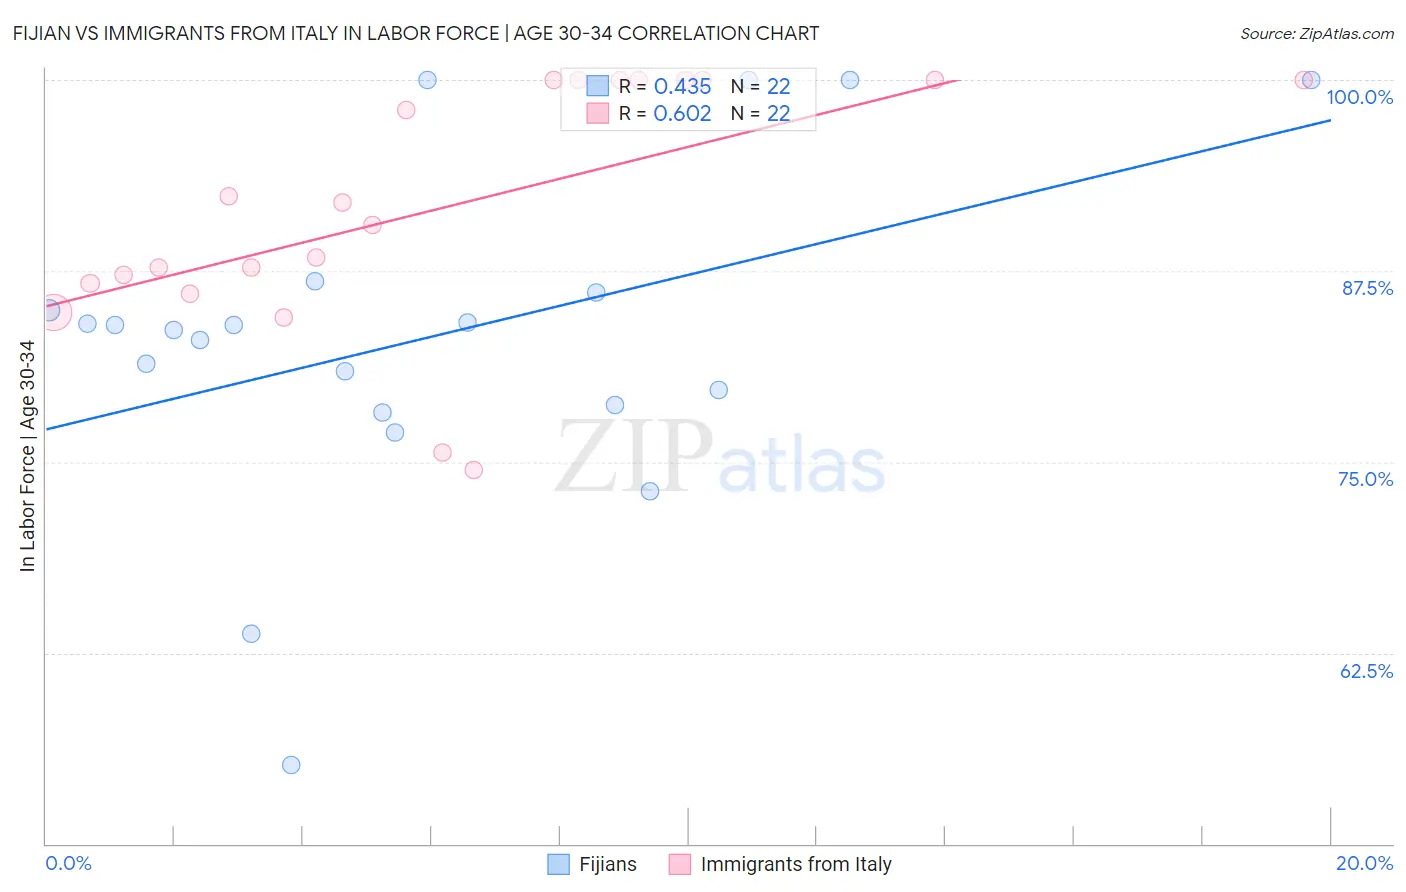
Fijian vs Immigrants from Italy In Labor Force | Age 30-34 Correlation Chart
The statistical analysis conducted on geographies consisting of 55,946,113 people shows a moderate positive correlation between the proportion of Fijians and labor force participation rate among population between the ages 30 and 34 in the United States with a correlation coefficient (R) of 0.435 and weighted average of 83.4%. Similarly, the statistical analysis conducted on geographies consisting of 324,081,928 people shows a significant positive correlation between the proportion of Immigrants from Italy and labor force participation rate among population between the ages 30 and 34 in the United States with a correlation coefficient (R) of 0.602 and weighted average of 85.7%, a difference of 2.7%.
In Labor Force | Age 30-34 Correlation Summary
| Measurement | Fijian | Immigrants from Italy |
| Minimum | 55.2% | 74.5% |
| Maximum | 100.0% | 100.0% |
| Range | 44.8% | 25.5% |
| Mean | 83.1% | 91.6% |
| Median | 83.8% | 91.3% |
| Interquartile 25% (IQ1) | 78.7% | 86.7% |
| Interquartile 75% (IQ3) | 86.1% | 100.0% |
| Interquartile Range (IQR) | 7.4% | 13.3% |
| Standard Deviation (Sample) | 11.0% | 8.1% |
| Standard Deviation (Population) | 10.7% | 7.9% |
Similar Demographics by In Labor Force | Age 30-34
Demographics Similar to Fijians by In Labor Force | Age 30-34
In terms of in labor force | age 30-34, the demographic groups most similar to Fijians are Immigrants from Fiji (83.4%, a difference of 0.010%), African (83.4%, a difference of 0.040%), Delaware (83.5%, a difference of 0.050%), Tongan (83.5%, a difference of 0.070%), and Immigrants from Grenada (83.5%, a difference of 0.080%).
| Demographics | Rating | Rank | In Labor Force | Age 30-34 |
| Spanish | 0.0 /100 | #271 | Tragic 83.5% |
| Immigrants | Nonimmigrants | 0.0 /100 | #272 | Tragic 83.5% |
| Guamanians/Chamorros | 0.0 /100 | #273 | Tragic 83.5% |
| Belizeans | 0.0 /100 | #274 | Tragic 83.5% |
| Immigrants | Grenada | 0.0 /100 | #275 | Tragic 83.5% |
| Tongans | 0.0 /100 | #276 | Tragic 83.5% |
| Delaware | 0.0 /100 | #277 | Tragic 83.5% |
| Fijians | 0.0 /100 | #278 | Tragic 83.4% |
| Immigrants | Fiji | 0.0 /100 | #279 | Tragic 83.4% |
| Africans | 0.0 /100 | #280 | Tragic 83.4% |
| Samoans | 0.0 /100 | #281 | Tragic 83.3% |
| Mexican American Indians | 0.0 /100 | #282 | Tragic 83.2% |
| Assyrians/Chaldeans/Syriacs | 0.0 /100 | #283 | Tragic 83.2% |
| Immigrants | Belize | 0.0 /100 | #284 | Tragic 83.2% |
| Cree | 0.0 /100 | #285 | Tragic 83.2% |
Demographics Similar to Immigrants from Italy by In Labor Force | Age 30-34
In terms of in labor force | age 30-34, the demographic groups most similar to Immigrants from Italy are Zimbabwean (85.6%, a difference of 0.010%), Immigrants from Lithuania (85.6%, a difference of 0.010%), Turkish (85.7%, a difference of 0.030%), Immigrants from Sri Lanka (85.6%, a difference of 0.040%), and Immigrants from Nepal (85.6%, a difference of 0.040%).
| Demographics | Rating | Rank | In Labor Force | Age 30-34 |
| Ugandans | 99.9 /100 | #34 | Exceptional 85.8% |
| Serbians | 99.9 /100 | #35 | Exceptional 85.8% |
| Albanians | 99.9 /100 | #36 | Exceptional 85.7% |
| Norwegians | 99.9 /100 | #37 | Exceptional 85.7% |
| Immigrants | Greece | 99.9 /100 | #38 | Exceptional 85.7% |
| Eastern Europeans | 99.9 /100 | #39 | Exceptional 85.7% |
| Turks | 99.9 /100 | #40 | Exceptional 85.7% |
| Immigrants | Italy | 99.9 /100 | #41 | Exceptional 85.7% |
| Zimbabweans | 99.8 /100 | #42 | Exceptional 85.6% |
| Immigrants | Lithuania | 99.8 /100 | #43 | Exceptional 85.6% |
| Immigrants | Sri Lanka | 99.8 /100 | #44 | Exceptional 85.6% |
| Immigrants | Nepal | 99.8 /100 | #45 | Exceptional 85.6% |
| Immigrants | Morocco | 99.8 /100 | #46 | Exceptional 85.6% |
| Croatians | 99.8 /100 | #47 | Exceptional 85.6% |
| Immigrants | Sweden | 99.8 /100 | #48 | Exceptional 85.6% |