Fijian vs Immigrants from Uzbekistan In Labor Force | Age 30-34
COMPARE
Fijian
Immigrants from Uzbekistan
In Labor Force | Age 30-34
In Labor Force | Age 30-34 Comparison
Fijians
Immigrants from Uzbekistan
83.4%
IN LABOR FORCE | AGE 30-34
0.0/ 100
METRIC RATING
278th/ 347
METRIC RANK
84.7%
IN LABOR FORCE | AGE 30-34
49.1/ 100
METRIC RATING
176th/ 347
METRIC RANK
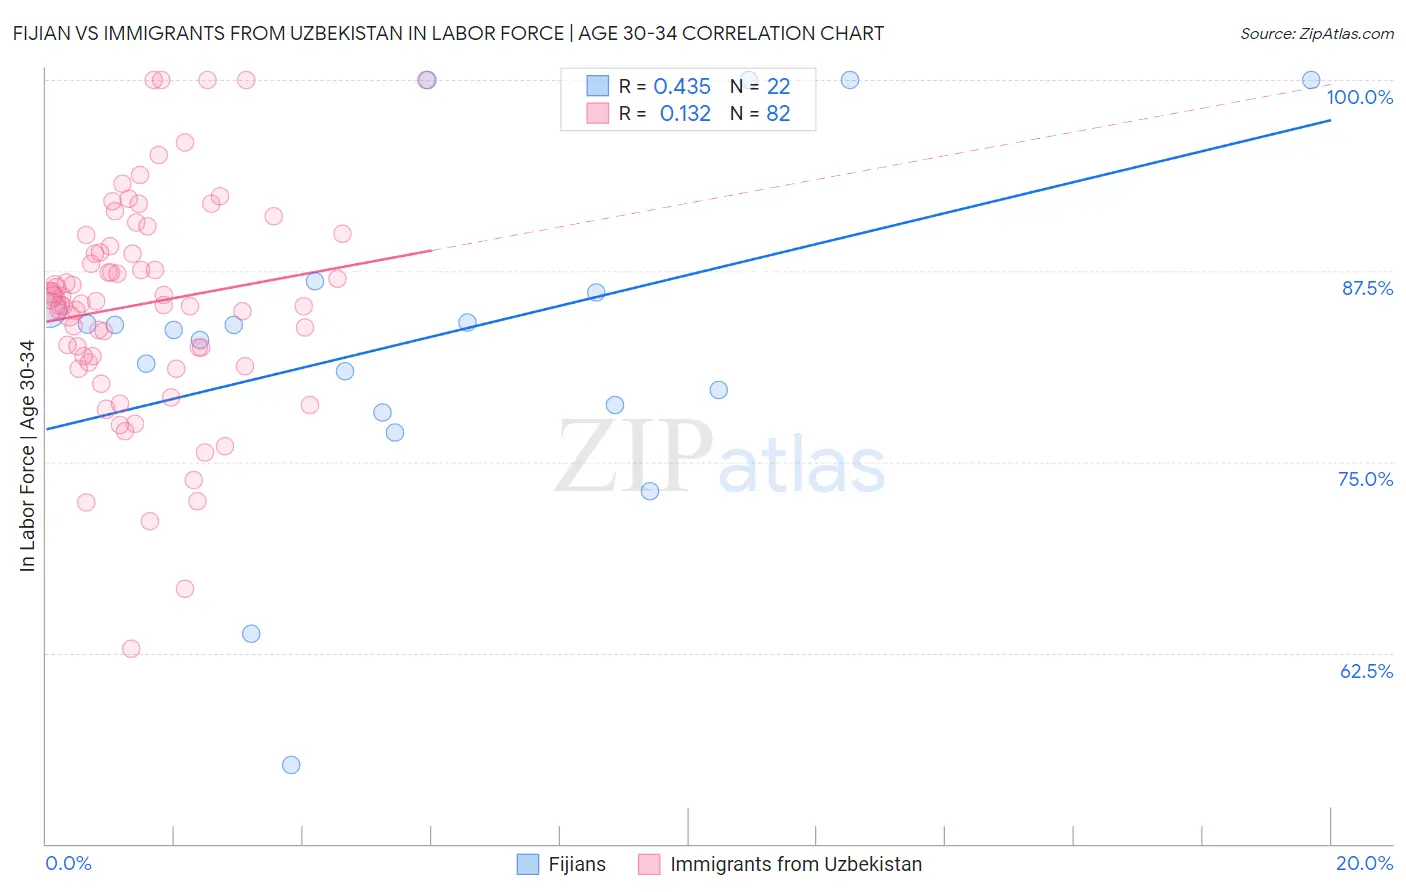
Fijian vs Immigrants from Uzbekistan In Labor Force | Age 30-34 Correlation Chart
The statistical analysis conducted on geographies consisting of 55,946,113 people shows a moderate positive correlation between the proportion of Fijians and labor force participation rate among population between the ages 30 and 34 in the United States with a correlation coefficient (R) of 0.435 and weighted average of 83.4%. Similarly, the statistical analysis conducted on geographies consisting of 118,740,878 people shows a poor positive correlation between the proportion of Immigrants from Uzbekistan and labor force participation rate among population between the ages 30 and 34 in the United States with a correlation coefficient (R) of 0.132 and weighted average of 84.7%, a difference of 1.5%.
In Labor Force | Age 30-34 Correlation Summary
| Measurement | Fijian | Immigrants from Uzbekistan |
| Minimum | 55.2% | 62.8% |
| Maximum | 100.0% | 100.0% |
| Range | 44.8% | 37.2% |
| Mean | 83.1% | 85.3% |
| Median | 83.8% | 85.5% |
| Interquartile 25% (IQ1) | 78.7% | 81.9% |
| Interquartile 75% (IQ3) | 86.1% | 89.1% |
| Interquartile Range (IQR) | 7.4% | 7.2% |
| Standard Deviation (Sample) | 11.0% | 7.1% |
| Standard Deviation (Population) | 10.7% | 7.1% |
Similar Demographics by In Labor Force | Age 30-34
Demographics Similar to Fijians by In Labor Force | Age 30-34
In terms of in labor force | age 30-34, the demographic groups most similar to Fijians are Immigrants from Fiji (83.4%, a difference of 0.010%), African (83.4%, a difference of 0.040%), Delaware (83.5%, a difference of 0.050%), Tongan (83.5%, a difference of 0.070%), and Immigrants from Grenada (83.5%, a difference of 0.080%).
| Demographics | Rating | Rank | In Labor Force | Age 30-34 |
| Spanish | 0.0 /100 | #271 | Tragic 83.5% |
| Immigrants | Nonimmigrants | 0.0 /100 | #272 | Tragic 83.5% |
| Guamanians/Chamorros | 0.0 /100 | #273 | Tragic 83.5% |
| Belizeans | 0.0 /100 | #274 | Tragic 83.5% |
| Immigrants | Grenada | 0.0 /100 | #275 | Tragic 83.5% |
| Tongans | 0.0 /100 | #276 | Tragic 83.5% |
| Delaware | 0.0 /100 | #277 | Tragic 83.5% |
| Fijians | 0.0 /100 | #278 | Tragic 83.4% |
| Immigrants | Fiji | 0.0 /100 | #279 | Tragic 83.4% |
| Africans | 0.0 /100 | #280 | Tragic 83.4% |
| Samoans | 0.0 /100 | #281 | Tragic 83.3% |
| Mexican American Indians | 0.0 /100 | #282 | Tragic 83.2% |
| Assyrians/Chaldeans/Syriacs | 0.0 /100 | #283 | Tragic 83.2% |
| Immigrants | Belize | 0.0 /100 | #284 | Tragic 83.2% |
| Cree | 0.0 /100 | #285 | Tragic 83.2% |
Demographics Similar to Immigrants from Uzbekistan by In Labor Force | Age 30-34
In terms of in labor force | age 30-34, the demographic groups most similar to Immigrants from Uzbekistan are Israeli (84.7%, a difference of 0.010%), Finnish (84.7%, a difference of 0.010%), Immigrants from South America (84.7%, a difference of 0.010%), South American Indian (84.7%, a difference of 0.020%), and Immigrants from Burma/Myanmar (84.7%, a difference of 0.020%).
| Demographics | Rating | Rank | In Labor Force | Age 30-34 |
| South American Indians | 52.1 /100 | #169 | Average 84.7% |
| Immigrants | Burma/Myanmar | 52.0 /100 | #170 | Average 84.7% |
| Irish | 52.0 /100 | #171 | Average 84.7% |
| Immigrants | England | 51.7 /100 | #172 | Average 84.7% |
| Israelis | 51.1 /100 | #173 | Average 84.7% |
| Finns | 50.0 /100 | #174 | Average 84.7% |
| Immigrants | South America | 50.0 /100 | #175 | Average 84.7% |
| Immigrants | Uzbekistan | 49.1 /100 | #176 | Average 84.7% |
| Laotians | 46.9 /100 | #177 | Average 84.7% |
| Okinawans | 44.1 /100 | #178 | Average 84.6% |
| Immigrants | Nigeria | 42.5 /100 | #179 | Average 84.6% |
| Immigrants | Netherlands | 42.1 /100 | #180 | Average 84.6% |
| Moroccans | 40.3 /100 | #181 | Average 84.6% |
| Barbadians | 36.7 /100 | #182 | Fair 84.6% |
| Immigrants | Canada | 35.0 /100 | #183 | Fair 84.6% |