Egyptian vs Immigrants from Malaysia In Labor Force | Age 20-64
COMPARE
Egyptian
Immigrants from Malaysia
In Labor Force | Age 20-64
In Labor Force | Age 20-64 Comparison
Egyptians
Immigrants from Malaysia
80.2%
IN LABOR FORCE | AGE 20-64
97.8/ 100
METRIC RATING
76th/ 347
METRIC RANK
80.1%
IN LABOR FORCE | AGE 20-64
95.9/ 100
METRIC RATING
96th/ 347
METRIC RANK
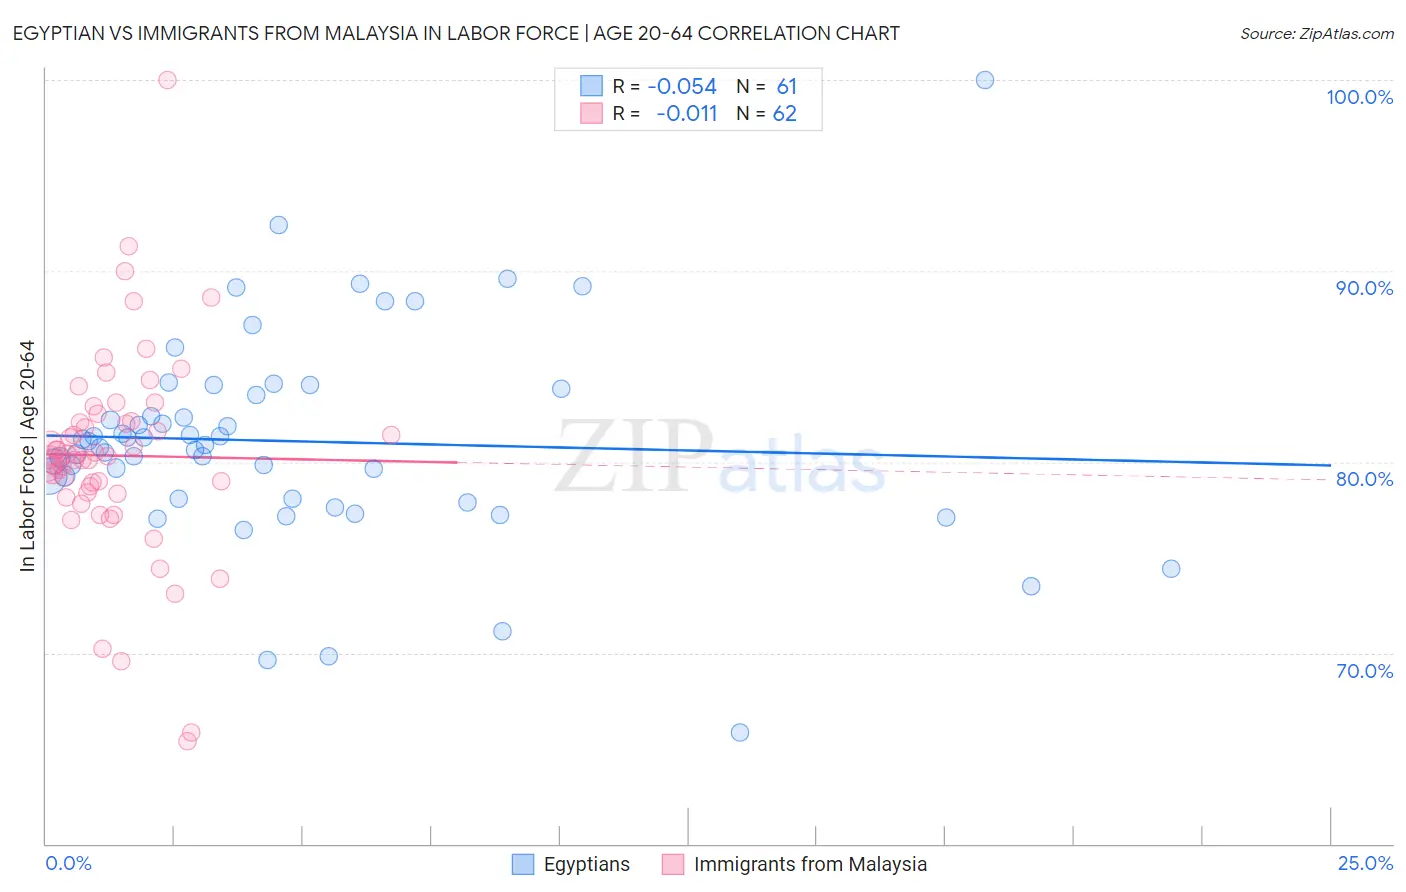
Egyptian vs Immigrants from Malaysia In Labor Force | Age 20-64 Correlation Chart
The statistical analysis conducted on geographies consisting of 276,929,100 people shows a slight negative correlation between the proportion of Egyptians and labor force participation rate among population between the ages 20 and 64 in the United States with a correlation coefficient (R) of -0.054 and weighted average of 80.2%. Similarly, the statistical analysis conducted on geographies consisting of 197,972,678 people shows no correlation between the proportion of Immigrants from Malaysia and labor force participation rate among population between the ages 20 and 64 in the United States with a correlation coefficient (R) of -0.011 and weighted average of 80.1%, a difference of 0.13%.
In Labor Force | Age 20-64 Correlation Summary
| Measurement | Egyptian | Immigrants from Malaysia |
| Minimum | 65.8% | 65.4% |
| Maximum | 100.0% | 100.0% |
| Range | 34.2% | 34.6% |
| Mean | 81.1% | 80.3% |
| Median | 80.9% | 80.3% |
| Interquartile 25% (IQ1) | 78.1% | 78.4% |
| Interquartile 75% (IQ3) | 83.6% | 82.1% |
| Interquartile Range (IQR) | 5.6% | 3.7% |
| Standard Deviation (Sample) | 5.5% | 5.4% |
| Standard Deviation (Population) | 5.5% | 5.4% |
Demographics Similar to Egyptians and Immigrants from Malaysia by In Labor Force | Age 20-64
In terms of in labor force | age 20-64, the demographic groups most similar to Egyptians are Immigrants from Colombia (80.2%, a difference of 0.0%), Immigrants from Romania (80.2%, a difference of 0.0%), Asian (80.2%, a difference of 0.010%), Immigrants from Croatia (80.1%, a difference of 0.020%), and German Russian (80.1%, a difference of 0.040%). Similarly, the demographic groups most similar to Immigrants from Malaysia are Yugoslavian (80.1%, a difference of 0.0%), Immigrants from Asia (80.1%, a difference of 0.010%), Immigrants from Belarus (80.1%, a difference of 0.020%), Uruguayan (80.1%, a difference of 0.040%), and Ghanaian (80.1%, a difference of 0.040%).
| Demographics | Rating | Rank | In Labor Force | Age 20-64 |
| Egyptians | 97.8 /100 | #76 | Exceptional 80.2% |
| Immigrants | Colombia | 97.8 /100 | #77 | Exceptional 80.2% |
| Immigrants | Romania | 97.8 /100 | #78 | Exceptional 80.2% |
| Asians | 97.7 /100 | #79 | Exceptional 80.2% |
| Immigrants | Croatia | 97.6 /100 | #80 | Exceptional 80.1% |
| German Russians | 97.3 /100 | #81 | Exceptional 80.1% |
| Immigrants | Japan | 97.3 /100 | #82 | Exceptional 80.1% |
| Colombians | 97.3 /100 | #83 | Exceptional 80.1% |
| Immigrants | Latvia | 97.2 /100 | #84 | Exceptional 80.1% |
| Jordanians | 97.2 /100 | #85 | Exceptional 80.1% |
| Immigrants | Egypt | 97.1 /100 | #86 | Exceptional 80.1% |
| Croatians | 97.1 /100 | #87 | Exceptional 80.1% |
| Chileans | 97.0 /100 | #88 | Exceptional 80.1% |
| Immigrants | Venezuela | 96.8 /100 | #89 | Exceptional 80.1% |
| Poles | 96.8 /100 | #90 | Exceptional 80.1% |
| Uruguayans | 96.7 /100 | #91 | Exceptional 80.1% |
| Ghanaians | 96.7 /100 | #92 | Exceptional 80.1% |
| Immigrants | Belarus | 96.4 /100 | #93 | Exceptional 80.1% |
| Immigrants | Asia | 96.0 /100 | #94 | Exceptional 80.1% |
| Yugoslavians | 95.9 /100 | #95 | Exceptional 80.1% |
| Immigrants | Malaysia | 95.9 /100 | #96 | Exceptional 80.1% |