Egyptian vs Immigrants from Malaysia Single Mother Poverty
COMPARE
Egyptian
Immigrants from Malaysia
Single Mother Poverty
Single Mother Poverty Comparison
Egyptians
Immigrants from Malaysia
26.9%
SINGLE MOTHER POVERTY
99.8/ 100
METRIC RATING
47th/ 347
METRIC RANK
27.3%
SINGLE MOTHER POVERTY
99.5/ 100
METRIC RATING
62nd/ 347
METRIC RANK
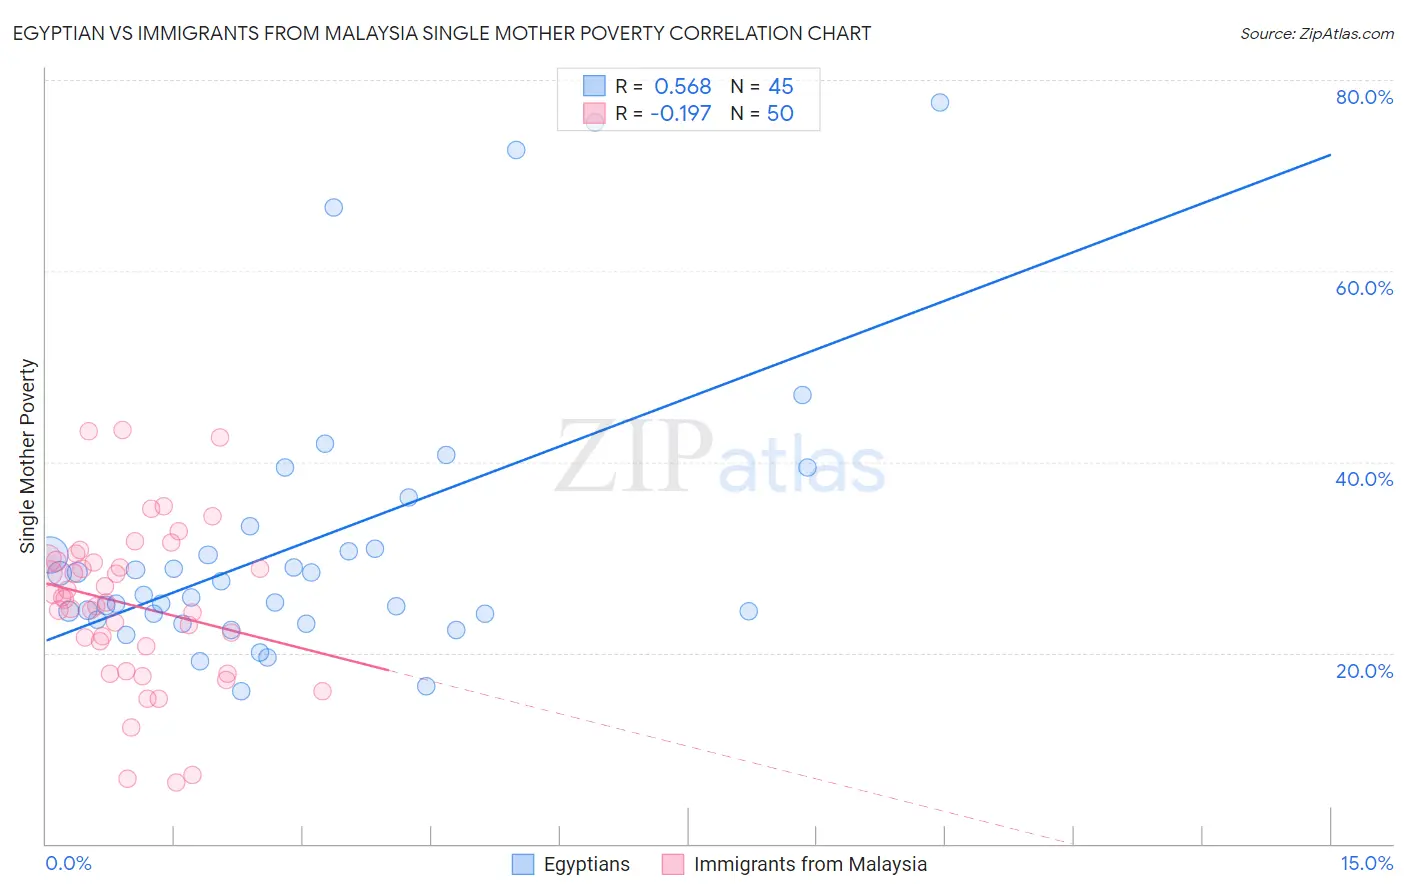
Egyptian vs Immigrants from Malaysia Single Mother Poverty Correlation Chart
The statistical analysis conducted on geographies consisting of 271,623,906 people shows a substantial positive correlation between the proportion of Egyptians and poverty level among single mothers in the United States with a correlation coefficient (R) of 0.568 and weighted average of 26.9%. Similarly, the statistical analysis conducted on geographies consisting of 194,970,165 people shows a poor negative correlation between the proportion of Immigrants from Malaysia and poverty level among single mothers in the United States with a correlation coefficient (R) of -0.197 and weighted average of 27.3%, a difference of 1.4%.
Single Mother Poverty Correlation Summary
| Measurement | Egyptian | Immigrants from Malaysia |
| Minimum | 15.9% | 6.4% |
| Maximum | 77.6% | 43.4% |
| Range | 61.7% | 37.0% |
| Mean | 31.5% | 25.0% |
| Median | 26.1% | 25.4% |
| Interquartile 25% (IQ1) | 23.8% | 20.7% |
| Interquartile 75% (IQ3) | 32.1% | 29.6% |
| Interquartile Range (IQR) | 8.3% | 9.0% |
| Standard Deviation (Sample) | 14.7% | 8.3% |
| Standard Deviation (Population) | 14.6% | 8.3% |
Demographics Similar to Egyptians and Immigrants from Malaysia by Single Mother Poverty
In terms of single mother poverty, the demographic groups most similar to Egyptians are Immigrants from Serbia (26.9%, a difference of 0.060%), Immigrants from Poland (26.9%, a difference of 0.080%), Latvian (26.9%, a difference of 0.10%), Cambodian (27.0%, a difference of 0.16%), and Laotian (27.0%, a difference of 0.17%). Similarly, the demographic groups most similar to Immigrants from Malaysia are Immigrants from Northern Europe (27.3%, a difference of 0.050%), Russian (27.3%, a difference of 0.080%), Immigrants from Eastern Europe (27.2%, a difference of 0.14%), Eastern European (27.2%, a difference of 0.25%), and Paraguayan (27.2%, a difference of 0.28%).
| Demographics | Rating | Rank | Single Mother Poverty |
| Immigrants | Sierra Leone | 99.9 /100 | #44 | Exceptional 26.9% |
| Latvians | 99.9 /100 | #45 | Exceptional 26.9% |
| Immigrants | Serbia | 99.9 /100 | #46 | Exceptional 26.9% |
| Egyptians | 99.8 /100 | #47 | Exceptional 26.9% |
| Immigrants | Poland | 99.8 /100 | #48 | Exceptional 26.9% |
| Cambodians | 99.8 /100 | #49 | Exceptional 27.0% |
| Laotians | 99.8 /100 | #50 | Exceptional 27.0% |
| Immigrants | Argentina | 99.7 /100 | #51 | Exceptional 27.1% |
| Immigrants | South Eastern Asia | 99.7 /100 | #52 | Exceptional 27.1% |
| Immigrants | Jordan | 99.7 /100 | #53 | Exceptional 27.1% |
| Immigrants | Bulgaria | 99.7 /100 | #54 | Exceptional 27.1% |
| Immigrants | Egypt | 99.7 /100 | #55 | Exceptional 27.1% |
| Immigrants | Romania | 99.7 /100 | #56 | Exceptional 27.2% |
| Palestinians | 99.7 /100 | #57 | Exceptional 27.2% |
| Argentineans | 99.6 /100 | #58 | Exceptional 27.2% |
| Paraguayans | 99.6 /100 | #59 | Exceptional 27.2% |
| Eastern Europeans | 99.6 /100 | #60 | Exceptional 27.2% |
| Immigrants | Eastern Europe | 99.6 /100 | #61 | Exceptional 27.2% |
| Immigrants | Malaysia | 99.5 /100 | #62 | Exceptional 27.3% |
| Immigrants | Northern Europe | 99.5 /100 | #63 | Exceptional 27.3% |
| Russians | 99.5 /100 | #64 | Exceptional 27.3% |