Egyptian vs Immigrants from Malaysia In Labor Force | Age 20-24
COMPARE
Egyptian
Immigrants from Malaysia
In Labor Force | Age 20-24
In Labor Force | Age 20-24 Comparison
Egyptians
Immigrants from Malaysia
73.7%
IN LABOR FORCE | AGE 20-24
0.7/ 100
METRIC RATING
258th/ 347
METRIC RANK
73.3%
IN LABOR FORCE | AGE 20-24
0.2/ 100
METRIC RATING
277th/ 347
METRIC RANK
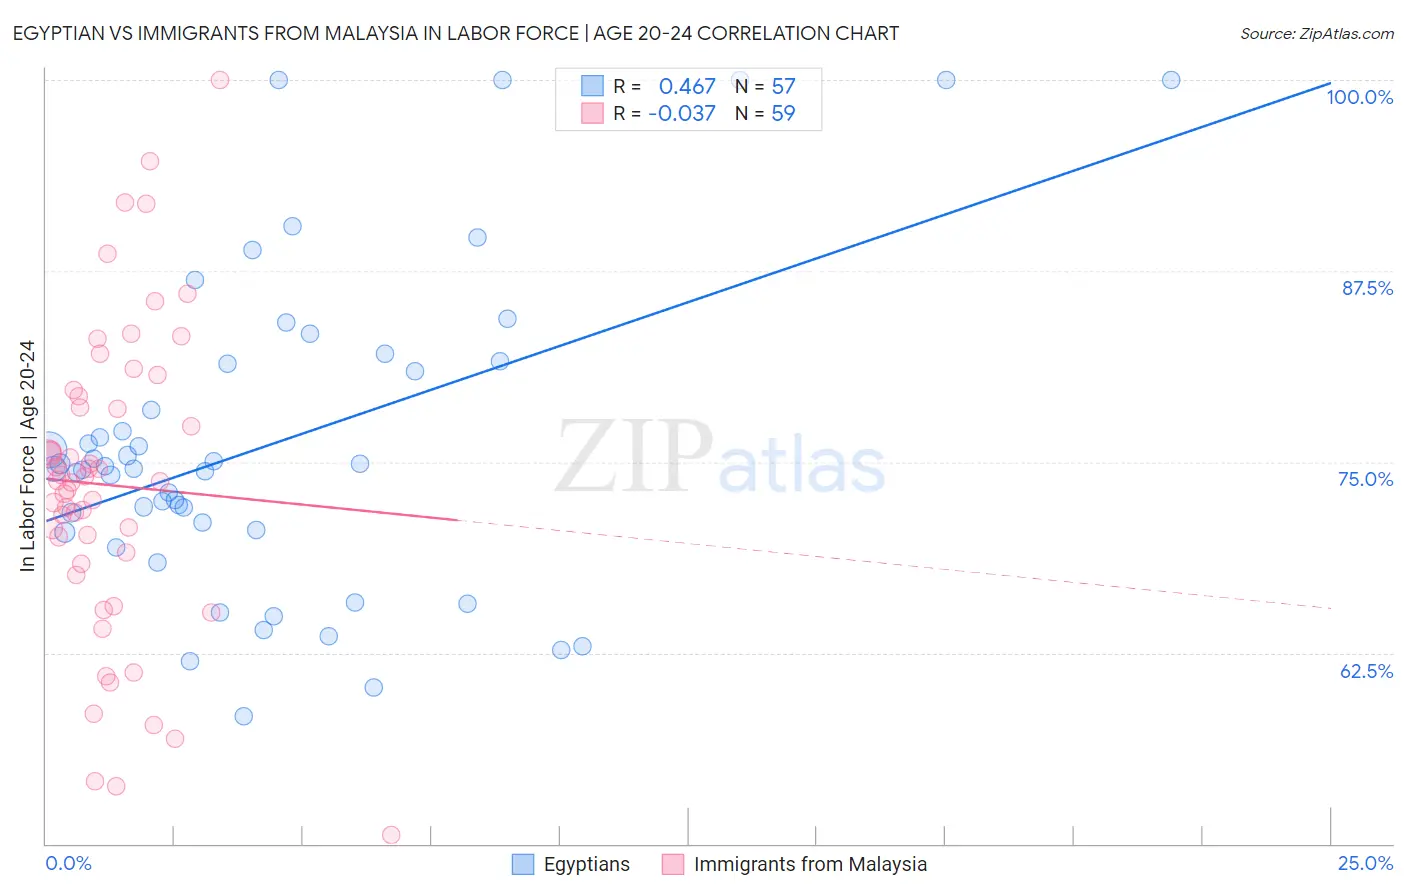
Egyptian vs Immigrants from Malaysia In Labor Force | Age 20-24 Correlation Chart
The statistical analysis conducted on geographies consisting of 276,889,106 people shows a moderate positive correlation between the proportion of Egyptians and labor force participation rate among population between the ages 20 and 24 in the United States with a correlation coefficient (R) of 0.467 and weighted average of 73.7%. Similarly, the statistical analysis conducted on geographies consisting of 197,961,052 people shows no correlation between the proportion of Immigrants from Malaysia and labor force participation rate among population between the ages 20 and 24 in the United States with a correlation coefficient (R) of -0.037 and weighted average of 73.3%, a difference of 0.49%.
In Labor Force | Age 20-24 Correlation Summary
| Measurement | Egyptian | Immigrants from Malaysia |
| Minimum | 58.3% | 50.6% |
| Maximum | 100.0% | 100.0% |
| Range | 41.7% | 49.4% |
| Mean | 76.2% | 73.5% |
| Median | 74.6% | 73.7% |
| Interquartile 25% (IQ1) | 70.5% | 68.4% |
| Interquartile 75% (IQ3) | 81.5% | 79.3% |
| Interquartile Range (IQR) | 11.0% | 11.0% |
| Standard Deviation (Sample) | 10.4% | 10.1% |
| Standard Deviation (Population) | 10.3% | 10.0% |
Demographics Similar to Egyptians and Immigrants from Malaysia by In Labor Force | Age 20-24
In terms of in labor force | age 20-24, the demographic groups most similar to Egyptians are Dutch West Indian (73.7%, a difference of 0.0%), Immigrants from Turkey (73.7%, a difference of 0.030%), Paraguayan (73.7%, a difference of 0.040%), Houma (73.7%, a difference of 0.040%), and Asian (73.7%, a difference of 0.050%). Similarly, the demographic groups most similar to Immigrants from Malaysia are Mongolian (73.3%, a difference of 0.010%), Immigrants from South America (73.3%, a difference of 0.020%), Immigrants from Colombia (73.4%, a difference of 0.070%), Cheyenne (73.4%, a difference of 0.090%), and Belizean (73.4%, a difference of 0.12%).
| Demographics | Rating | Rank | In Labor Force | Age 20-24 |
| Paraguayans | 0.8 /100 | #257 | Tragic 73.7% |
| Egyptians | 0.7 /100 | #258 | Tragic 73.7% |
| Dutch West Indians | 0.7 /100 | #259 | Tragic 73.7% |
| Immigrants | Turkey | 0.7 /100 | #260 | Tragic 73.7% |
| Houma | 0.6 /100 | #261 | Tragic 73.7% |
| Asians | 0.6 /100 | #262 | Tragic 73.7% |
| Immigrants | Asia | 0.5 /100 | #263 | Tragic 73.6% |
| Immigrants | Haiti | 0.5 /100 | #264 | Tragic 73.6% |
| Burmese | 0.5 /100 | #265 | Tragic 73.6% |
| Haitians | 0.5 /100 | #266 | Tragic 73.6% |
| Immigrants | Western Asia | 0.4 /100 | #267 | Tragic 73.5% |
| South Americans | 0.4 /100 | #268 | Tragic 73.5% |
| Colombians | 0.3 /100 | #269 | Tragic 73.5% |
| Immigrants | Russia | 0.3 /100 | #270 | Tragic 73.5% |
| Immigrants | Indonesia | 0.3 /100 | #271 | Tragic 73.4% |
| Belizeans | 0.3 /100 | #272 | Tragic 73.4% |
| Cheyenne | 0.2 /100 | #273 | Tragic 73.4% |
| Immigrants | Colombia | 0.2 /100 | #274 | Tragic 73.4% |
| Immigrants | South America | 0.2 /100 | #275 | Tragic 73.3% |
| Mongolians | 0.2 /100 | #276 | Tragic 73.3% |
| Immigrants | Malaysia | 0.2 /100 | #277 | Tragic 73.3% |