Egyptian vs Marshallese In Labor Force | Age 20-24
COMPARE
Egyptian
Marshallese
In Labor Force | Age 20-24
In Labor Force | Age 20-24 Comparison
Egyptians
Marshallese
73.7%
IN LABOR FORCE | AGE 20-24
0.7/ 100
METRIC RATING
258th/ 347
METRIC RANK
77.4%
IN LABOR FORCE | AGE 20-24
100.0/ 100
METRIC RATING
38th/ 347
METRIC RANK
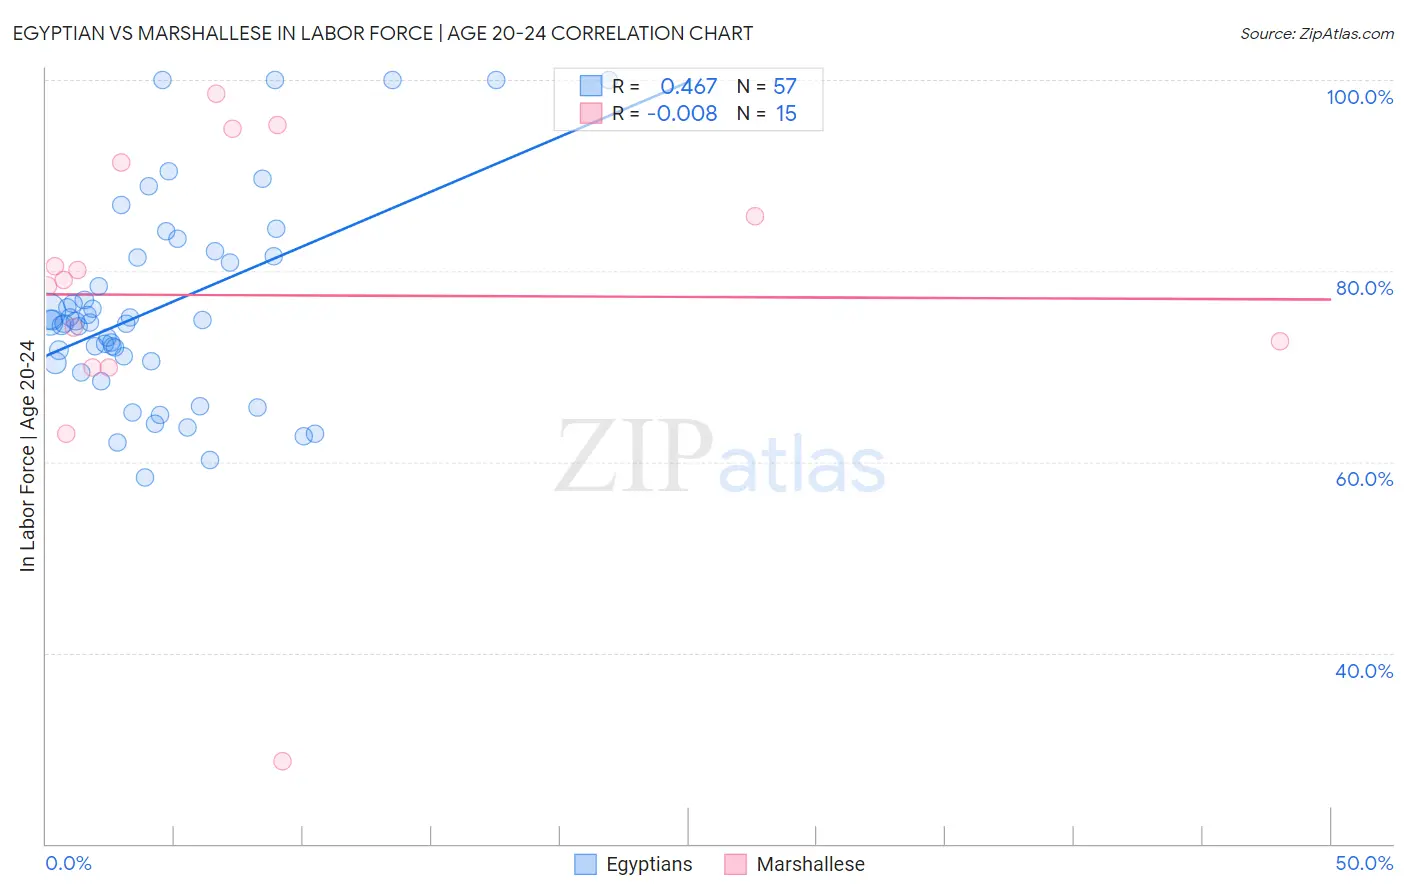
Egyptian vs Marshallese In Labor Force | Age 20-24 Correlation Chart
The statistical analysis conducted on geographies consisting of 276,889,106 people shows a moderate positive correlation between the proportion of Egyptians and labor force participation rate among population between the ages 20 and 24 in the United States with a correlation coefficient (R) of 0.467 and weighted average of 73.7%. Similarly, the statistical analysis conducted on geographies consisting of 14,760,991 people shows no correlation between the proportion of Marshallese and labor force participation rate among population between the ages 20 and 24 in the United States with a correlation coefficient (R) of -0.008 and weighted average of 77.4%, a difference of 5.1%.
In Labor Force | Age 20-24 Correlation Summary
| Measurement | Egyptian | Marshallese |
| Minimum | 58.3% | 28.6% |
| Maximum | 100.0% | 98.5% |
| Range | 41.7% | 69.9% |
| Mean | 76.2% | 77.5% |
| Median | 74.6% | 79.1% |
| Interquartile 25% (IQ1) | 70.5% | 69.9% |
| Interquartile 75% (IQ3) | 81.5% | 91.3% |
| Interquartile Range (IQR) | 11.0% | 21.4% |
| Standard Deviation (Sample) | 10.4% | 17.1% |
| Standard Deviation (Population) | 10.3% | 16.5% |
Similar Demographics by In Labor Force | Age 20-24
Demographics Similar to Egyptians by In Labor Force | Age 20-24
In terms of in labor force | age 20-24, the demographic groups most similar to Egyptians are Dutch West Indian (73.7%, a difference of 0.0%), Immigrants from Turkey (73.7%, a difference of 0.030%), Paraguayan (73.7%, a difference of 0.040%), Houma (73.7%, a difference of 0.040%), and Asian (73.7%, a difference of 0.050%).
| Demographics | Rating | Rank | In Labor Force | Age 20-24 |
| Immigrants | Egypt | 1.2 /100 | #251 | Tragic 73.8% |
| Immigrants | Kazakhstan | 1.1 /100 | #252 | Tragic 73.8% |
| Arapaho | 1.0 /100 | #253 | Tragic 73.8% |
| Ute | 1.0 /100 | #254 | Tragic 73.8% |
| Immigrants | Pakistan | 0.9 /100 | #255 | Tragic 73.8% |
| Spanish American Indians | 0.8 /100 | #256 | Tragic 73.7% |
| Paraguayans | 0.8 /100 | #257 | Tragic 73.7% |
| Egyptians | 0.7 /100 | #258 | Tragic 73.7% |
| Dutch West Indians | 0.7 /100 | #259 | Tragic 73.7% |
| Immigrants | Turkey | 0.7 /100 | #260 | Tragic 73.7% |
| Houma | 0.6 /100 | #261 | Tragic 73.7% |
| Asians | 0.6 /100 | #262 | Tragic 73.7% |
| Immigrants | Asia | 0.5 /100 | #263 | Tragic 73.6% |
| Immigrants | Haiti | 0.5 /100 | #264 | Tragic 73.6% |
| Burmese | 0.5 /100 | #265 | Tragic 73.6% |
Demographics Similar to Marshallese by In Labor Force | Age 20-24
In terms of in labor force | age 20-24, the demographic groups most similar to Marshallese are Irish (77.4%, a difference of 0.030%), Czechoslovakian (77.5%, a difference of 0.050%), Scottish (77.4%, a difference of 0.060%), Welsh (77.5%, a difference of 0.070%), and Immigrants from Congo (77.4%, a difference of 0.070%).
| Demographics | Rating | Rank | In Labor Force | Age 20-24 |
| Poles | 100.0 /100 | #31 | Exceptional 77.6% |
| English | 100.0 /100 | #32 | Exceptional 77.6% |
| Immigrants | Ethiopia | 100.0 /100 | #33 | Exceptional 77.5% |
| German Russians | 100.0 /100 | #34 | Exceptional 77.5% |
| Immigrants | Eastern Africa | 100.0 /100 | #35 | Exceptional 77.5% |
| Welsh | 100.0 /100 | #36 | Exceptional 77.5% |
| Czechoslovakians | 100.0 /100 | #37 | Exceptional 77.5% |
| Marshallese | 100.0 /100 | #38 | Exceptional 77.4% |
| Irish | 100.0 /100 | #39 | Exceptional 77.4% |
| Scottish | 100.0 /100 | #40 | Exceptional 77.4% |
| Immigrants | Congo | 100.0 /100 | #41 | Exceptional 77.4% |
| French | 100.0 /100 | #42 | Exceptional 77.4% |
| Immigrants | Laos | 100.0 /100 | #43 | Exceptional 77.4% |
| Fijians | 100.0 /100 | #44 | Exceptional 77.4% |
| Native Hawaiians | 100.0 /100 | #45 | Exceptional 77.4% |