Osage vs Immigrants from Fiji In Labor Force | Age 20-24
COMPARE
Osage
Immigrants from Fiji
In Labor Force | Age 20-24
In Labor Force | Age 20-24 Comparison
Osage
Immigrants from Fiji
75.3%
IN LABOR FORCE | AGE 20-24
72.3/ 100
METRIC RATING
154th/ 347
METRIC RANK
74.3%
IN LABOR FORCE | AGE 20-24
5.9/ 100
METRIC RATING
226th/ 347
METRIC RANK
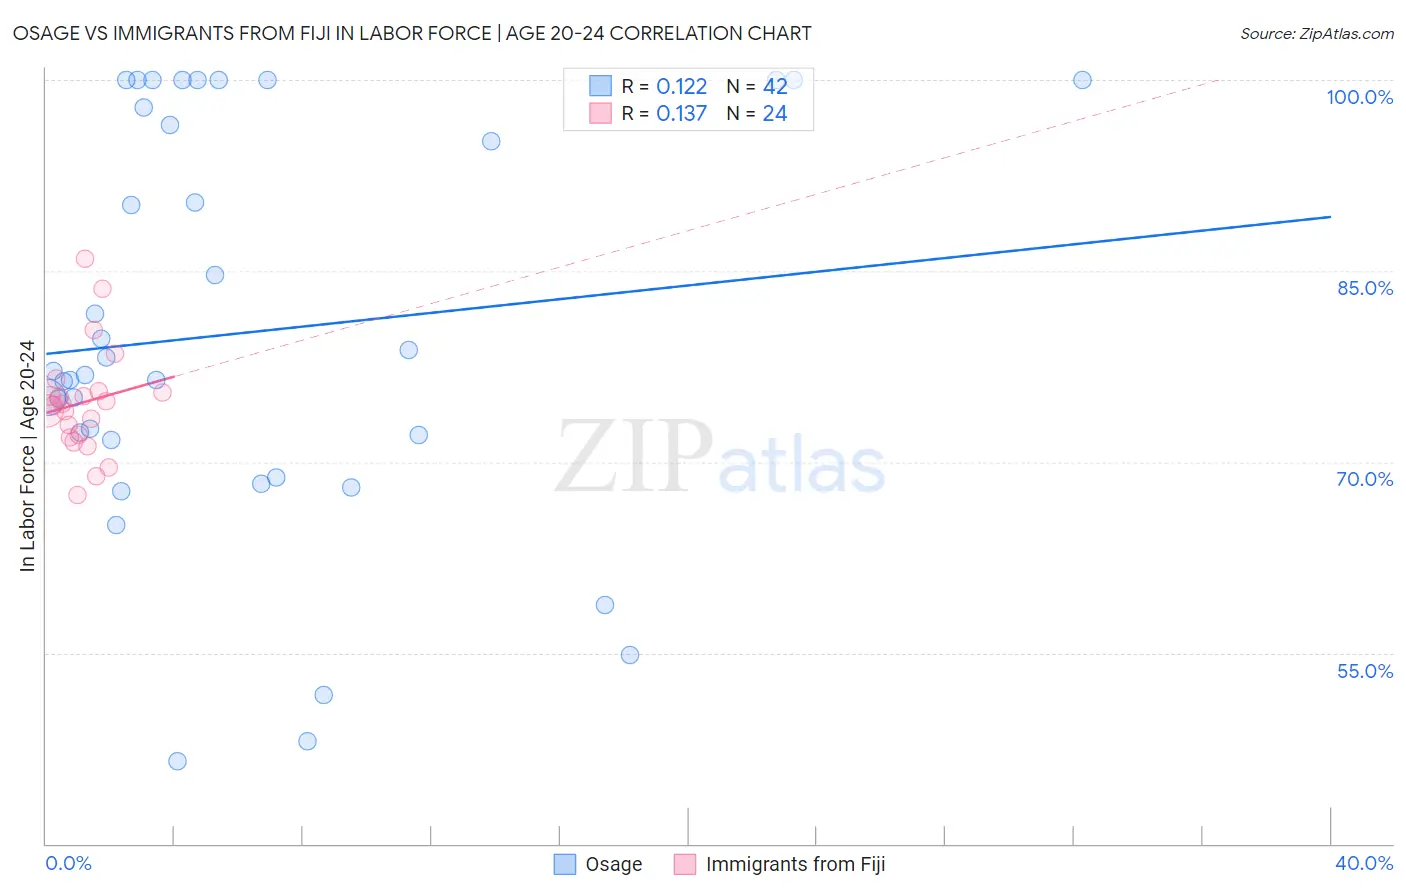
Osage vs Immigrants from Fiji In Labor Force | Age 20-24 Correlation Chart
The statistical analysis conducted on geographies consisting of 91,790,564 people shows a poor positive correlation between the proportion of Osage and labor force participation rate among population between the ages 20 and 24 in the United States with a correlation coefficient (R) of 0.122 and weighted average of 75.3%. Similarly, the statistical analysis conducted on geographies consisting of 93,752,129 people shows a poor positive correlation between the proportion of Immigrants from Fiji and labor force participation rate among population between the ages 20 and 24 in the United States with a correlation coefficient (R) of 0.137 and weighted average of 74.3%, a difference of 1.4%.
In Labor Force | Age 20-24 Correlation Summary
| Measurement | Osage | Immigrants from Fiji |
| Minimum | 46.5% | 67.4% |
| Maximum | 100.0% | 86.0% |
| Range | 53.5% | 18.6% |
| Mean | 80.2% | 74.7% |
| Median | 77.0% | 74.5% |
| Interquartile 25% (IQ1) | 71.7% | 72.0% |
| Interquartile 75% (IQ3) | 97.9% | 75.5% |
| Interquartile Range (IQR) | 26.2% | 3.5% |
| Standard Deviation (Sample) | 15.8% | 4.2% |
| Standard Deviation (Population) | 15.6% | 4.2% |
Similar Demographics by In Labor Force | Age 20-24
Demographics Similar to Osage by In Labor Force | Age 20-24
In terms of in labor force | age 20-24, the demographic groups most similar to Osage are Guatemalan (75.3%, a difference of 0.0%), Immigrants from Guatemala (75.3%, a difference of 0.010%), Immigrants from El Salvador (75.3%, a difference of 0.010%), Immigrants from Western Europe (75.3%, a difference of 0.010%), and Lebanese (75.3%, a difference of 0.020%).
| Demographics | Rating | Rank | In Labor Force | Age 20-24 |
| Comanche | 77.6 /100 | #147 | Good 75.4% |
| Immigrants | Cambodia | 76.7 /100 | #148 | Good 75.4% |
| Ugandans | 76.1 /100 | #149 | Good 75.4% |
| Salvadorans | 74.8 /100 | #150 | Good 75.3% |
| Paiute | 74.1 /100 | #151 | Good 75.3% |
| Lebanese | 73.5 /100 | #152 | Good 75.3% |
| Guatemalans | 72.3 /100 | #153 | Good 75.3% |
| Osage | 72.3 /100 | #154 | Good 75.3% |
| Immigrants | Guatemala | 71.9 /100 | #155 | Good 75.3% |
| Immigrants | El Salvador | 71.7 /100 | #156 | Good 75.3% |
| Immigrants | Western Europe | 71.5 /100 | #157 | Good 75.3% |
| Immigrants | Bolivia | 71.0 /100 | #158 | Good 75.3% |
| South American Indians | 69.0 /100 | #159 | Good 75.3% |
| Japanese | 68.7 /100 | #160 | Good 75.3% |
| New Zealanders | 65.4 /100 | #161 | Good 75.2% |
Demographics Similar to Immigrants from Fiji by In Labor Force | Age 20-24
In terms of in labor force | age 20-24, the demographic groups most similar to Immigrants from Fiji are Immigrants from Ireland (74.3%, a difference of 0.010%), Ghanaian (74.3%, a difference of 0.020%), Seminole (74.3%, a difference of 0.060%), Immigrants from Ukraine (74.2%, a difference of 0.060%), and Immigrants from Sweden (74.2%, a difference of 0.090%).
| Demographics | Rating | Rank | In Labor Force | Age 20-24 |
| Nepalese | 10.5 /100 | #219 | Poor 74.5% |
| Immigrants | Norway | 10.3 /100 | #220 | Poor 74.5% |
| Chickasaw | 10.3 /100 | #221 | Poor 74.5% |
| Immigrants | India | 9.9 /100 | #222 | Tragic 74.4% |
| Hispanics or Latinos | 7.9 /100 | #223 | Tragic 74.4% |
| Seminole | 6.9 /100 | #224 | Tragic 74.3% |
| Ghanaians | 6.2 /100 | #225 | Tragic 74.3% |
| Immigrants | Fiji | 5.9 /100 | #226 | Tragic 74.3% |
| Immigrants | Ireland | 5.8 /100 | #227 | Tragic 74.3% |
| Immigrants | Ukraine | 5.1 /100 | #228 | Tragic 74.2% |
| Immigrants | Sweden | 4.6 /100 | #229 | Tragic 74.2% |
| Immigrants | Albania | 4.3 /100 | #230 | Tragic 74.2% |
| Immigrants | Greece | 4.1 /100 | #231 | Tragic 74.2% |
| Immigrants | Switzerland | 4.1 /100 | #232 | Tragic 74.2% |
| Immigrants | Chile | 3.7 /100 | #233 | Tragic 74.1% |